
How much are Americans paying to stay connected?
Reviews.org State of Consumer Media Spending 2026


 6 min read
 Edited ByKelly Huh
We surveyed 1,000 U.S. adults and calculated averages from current provider pricing data for our latest report, Reviews.org State of Consumer Media Spending 2026. Overall, the average American household spends $283.39 per month on home internet, mobile phone service, TV, and streaming. That's up about 1.5% from 2025, or $4.25 more per month. This projects to roughly $204,000 over a 60-year lifetime at current rates.
Standout finding: The average monthly spend on streaming increased by $9.57 per month or 19% from 2025 to 2026, while the average internet bill decreased by 8%.

Why you can trust us
At Reviews.org, our team takes its editorial independence seriously. We may earn money when readers click affiliate links, but we don't work for our brand partners, and they don’t approve our pieces before publication. To learn more, visit our About us page.
Key takeaways
The average 2026 monthly bill for an American household is as follows:
- Internet: $62.72/mo
- Cell phone service (Big Three carriers: AT&T, T-Mobile, and Verizon plans): $57.60/mo
- TV: $101.79/mo
- Streaming: $61.28/mo
On this page:

Meet the expert
Christian de Looper is a technology journalist with over 10 years of experience covering all aspects of the consumer tech industry, including smartphones, internet services, and TV plans. He has written for top tech publications including Digital Trends, Tom’s Guide, Forbes, CNN Underscored, PCMag, and more.

Reviews.org
The lifetime cost of staying connected
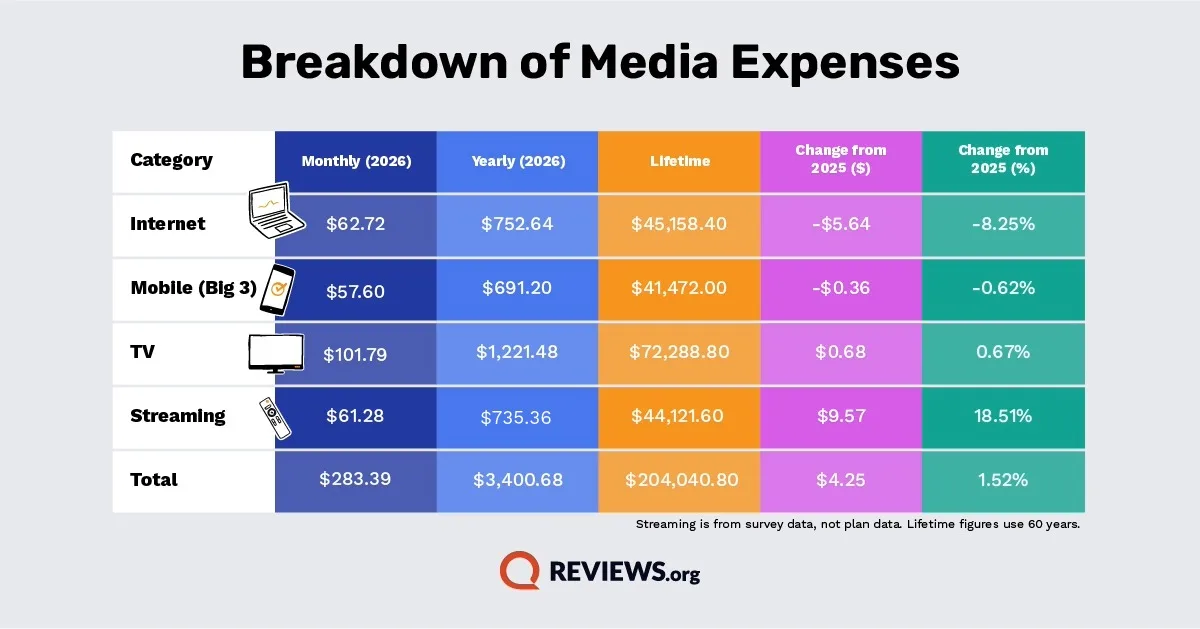
Rising streaming costs outweighed savings on internet and mobile, so the average household’s total connectivity bill went up this year. Infographic by Reviews.org
The average American household spends $204,041 on internet, mobile, TV, and streaming services over a lifetime. This is based on a monthly total of $283.39, or $3,400.68 per year.
- Streaming is as expensive as home internet, with both services costing $61–$63 per month.
- TV is the largest single expense at $101.79 per month — 62% more expensive than internet at $62.72, and 77% more expensive than mobile at $57.60.
Internet and streaming land within $1.50 of each other (per month), while mobile service is the lowest household media expense of the four.
Average cost of internet, mobile, TV, and streaming services in 2026
Monthly mobile cost is calculated from average plan prices from the "Big Three" providers: T-Mobile, Verizon, and AT&T. Lifetime calculation based on 60 years without adjusting for inflation or time value of money. TV figures reflect average cable, satellite, and live TV costs.
2026 vs. 2025 average cost of internet, mobile, TV, and streaming services
Annual consumer media spending increased by about 1.5%, but this doesn't tell the full story. Here’s how costs changed from 2025 to 2026:
- The cost of streaming increased by 19%, or by an extra $9.57 per month compared to 2025 — easily the biggest swing we observed.
- The cost of internet service moved the other direction, falling 8% and saving the average household $5.64 per month.
- The cost of mobile and traditional TV services barely budged, each changing less than a percentage point.
How much of your paycheck goes toward staying connected?
The total cost of internet, mobile service, TV, and streaming is 5.23% of a single full-time worker’s gross earnings, based on median weekly earnings of $1,251 for full-time wage and salary workers in Q2 2026, according to the U.S. Bureau of Labor Statistics ($65,052 annualized). This is one worker’s median pay measured against one household’s bill; a two-earner household spends a smaller share of its income on the same services.
The share is down by only 0.16 percentage points from 2025 (based on the lower median income of $62,192 per year). This doesn't account for the cost of devices themselves.
Average cost of home internet in 2026
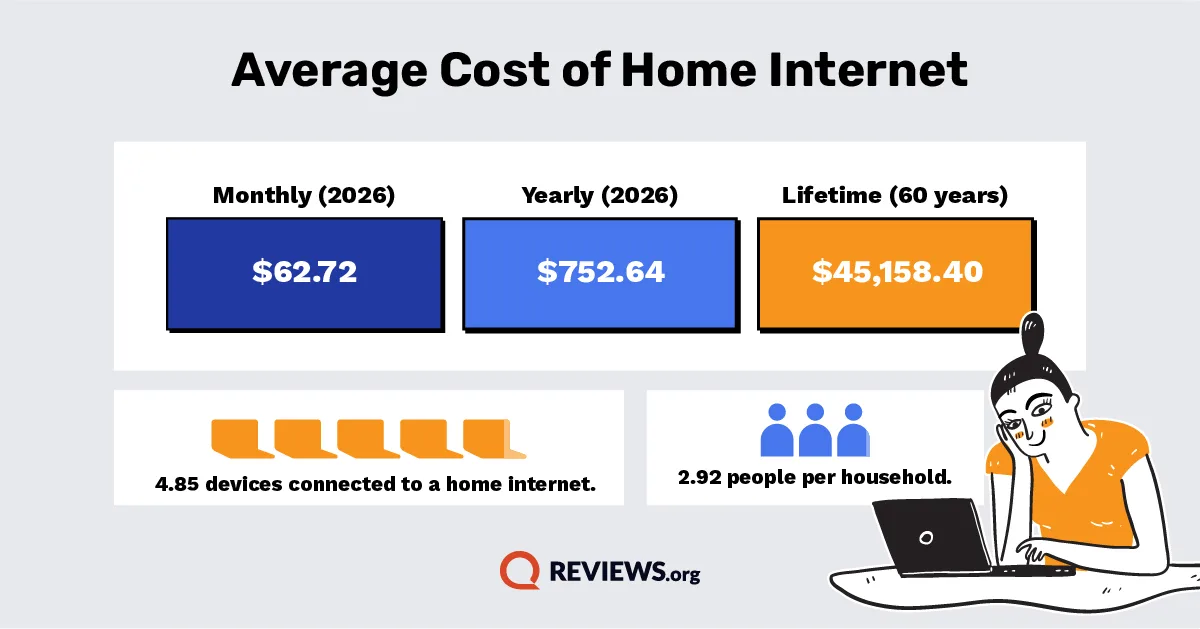
The average monthly cost of internet is $62.72. Infographic by Reviews.org
The average internet bill is $62.72 per month, down 8% from $68.36 in 2025.
Multiple market forces impact internet prices, such as:
- Increased competition from cellular providers such as AT&T, T-Mobile, and Verizon, offering 5G home internet services at lower prices and reducing fees.
- Fiber expansion offers faster speeds and more reliable service at similar or even lower prices than cable internet providers.
- Cable providers offer reduced promotional prices to keep customers interested in the service, often adding bundling deals, multi-year price guarantees, or increasing speeds without increasing rates.
How many devices does the average household have?
Survey respondents reported an average of 4.85 connected devices per household — roughly 1.66 per person, based on an average household size of 2.92.
Which home internet connection type do you have? 2026 vs. 2025
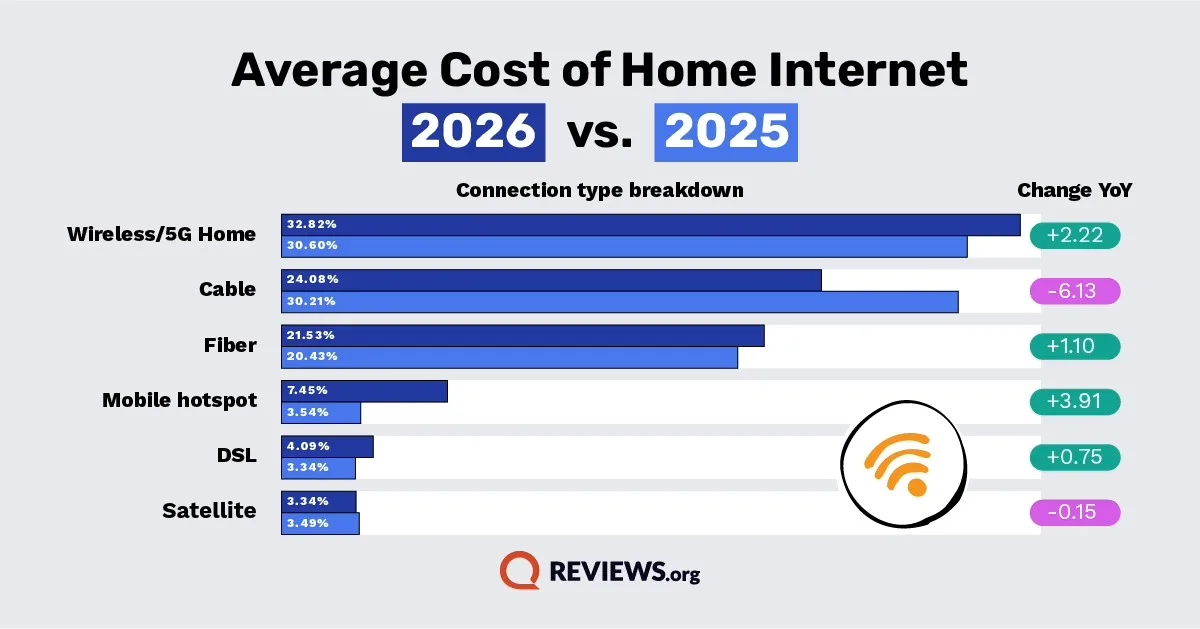
Rising streaming costs outweighed savings on internet and mobile, so the average household’s total connectivity bill went up this year. Infographic by Reviews.org
- Cable internet dropped sharply — down more than 6 percentage points to 24% —
- Fiber grew to 22%
- Mobile hotspot usage increased from 4% to 7%
- Satellite and DSL were essentially increased by less than 1 percentage point.
If you're shopping for a new internet plan, fiber remains the most reliable and fastest connection type where it's available. Cable internet is also a strong option that delivers fast speeds. For areas where wired internet like fiber or cable isn’t available, 5G home internet is a more affordable alternative, frequently with no long-term contract required.
Average cost of mobile plans in 2026
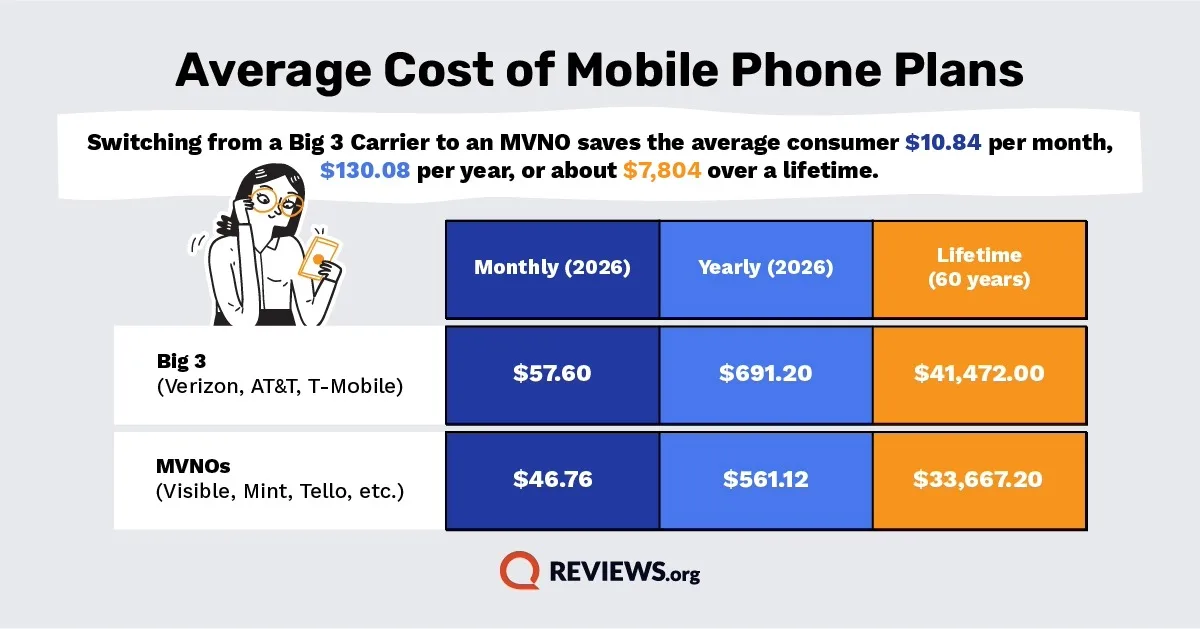
Switching from a Big Three carrier to an MVNO saves $130 per year per line. Infographic by Reviews.org
Average cost of mobile phone plans in 2026
How much is a phone bill per month? The average cell phone bill on the Big Three major carriers — Verizon, AT&T, and T-Mobile — is $57.60 in 2026, barely changed from $57.96 a year ago. That stability is welcome, but it still means $691.20 per year and $41,472 over a lifetime for a single line.
MVNOs offer a meaningfully cheaper option though. Mobile virtual network operators — carriers like Visible, Mint Mobile, and Tello — average $46.76 per month, saving roughly $130.08 per year per line, or about $7,804.80 over a lifetime.
MVNOs use the same network towers from the major carriers, but offer services under their own brand. They are often more affordable than major carriers. The tradeoffs may include reduced in-store support and limited options for device financing.
A notable change is that MVNO prices increased by 13% from an average price of $41.41 in 2025, so they aren't immune to increases. But the gap between them and the Big Three remains wide enough to make significant savings.
How much data do you use?
Data usage patterns are also shifting. Heavy data users consuming 40GB or more per month rose to 16% of respondents, up from 13% in 2025. At the other end, 11% said they rely on Wi-Fi and don't use cellular data at all — which raises the question of whether they need an unlimited plan in the first place.
Average cost of TV plans in 2026
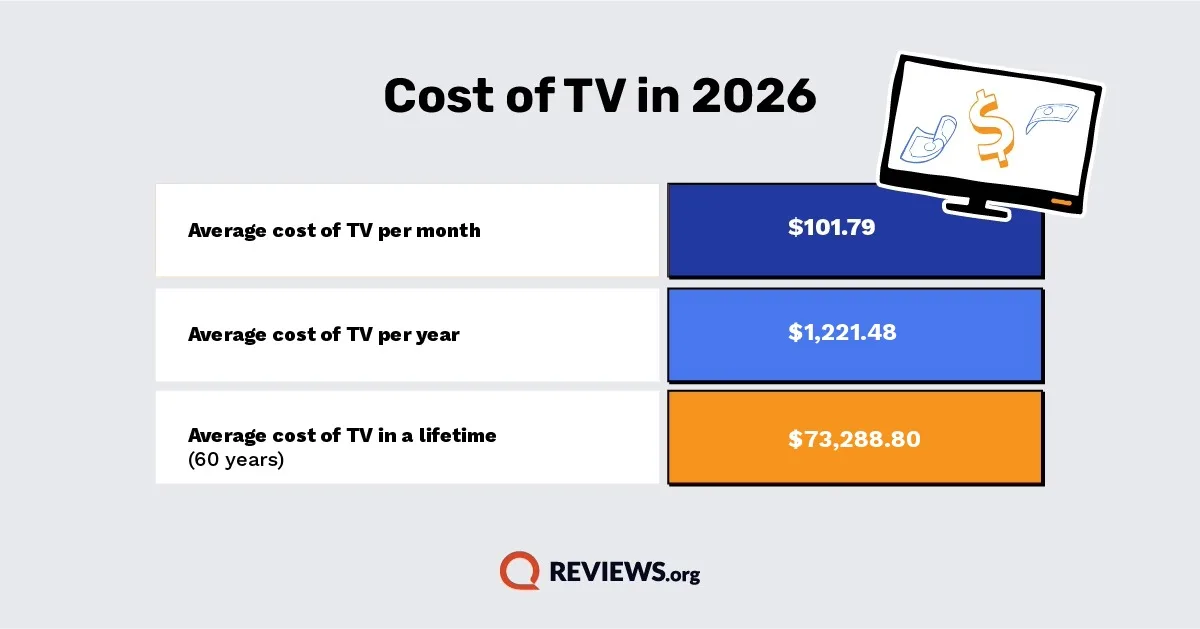
TV is still the most expensive bill for connected households. Infographic by Reviews.org
Average cost of TV services in 2026
Cost of cable TV, satellite TV, live TV, and streamed live TV
How much is cable per month? The average TV bill is $101.79 — barely changed from $101.11 in 2025, and still the most expensive category. That's $1,221.48 per year and $73,288.80 over a lifetime — and no other category even comes close. Add streaming on top and the total hits $163.07 per month, accounting for roughly 58% of overall media spending.
Types of TV services used in 2026
How Americans watch TV is evolving faster than what they pay for it. Live TV streaming services — YouTube TV, Hulu + Live TV, Fubo, and others — are the most popular option at 36% of respondents, well ahead of traditional cable at 25%. Satellite TV usage sits at 12%, and 10% use an over-the-air antenna.
Live TV streaming services generally offer comparable channel lineups to cable without the equipment rental fees, professional installation, or multi-year contracts. They aren't cheap, costing more than $80 per month. However, they're more flexible, and you can cancel without a penalty if your budget tightens.
Average cost of streaming TV plans in 2026
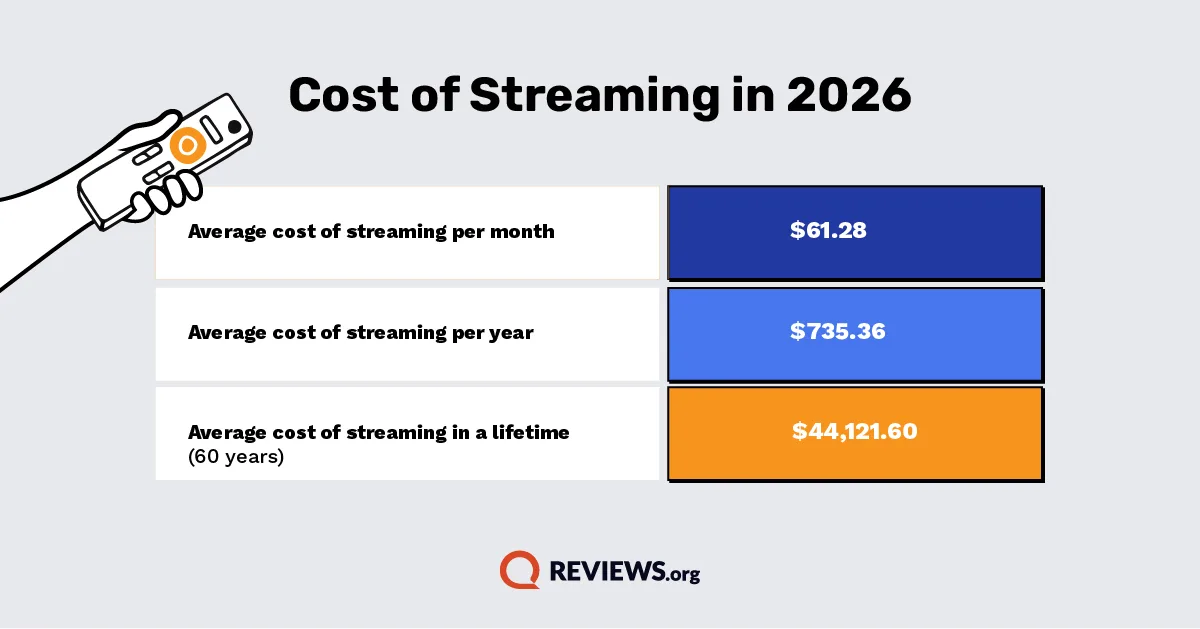
Streaming costs $61.28 month on average, according to the 2026 Reviews.org Consumer Media Spending Report. Infographic by Reviews.org
Average cost of streaming TV services in 2026
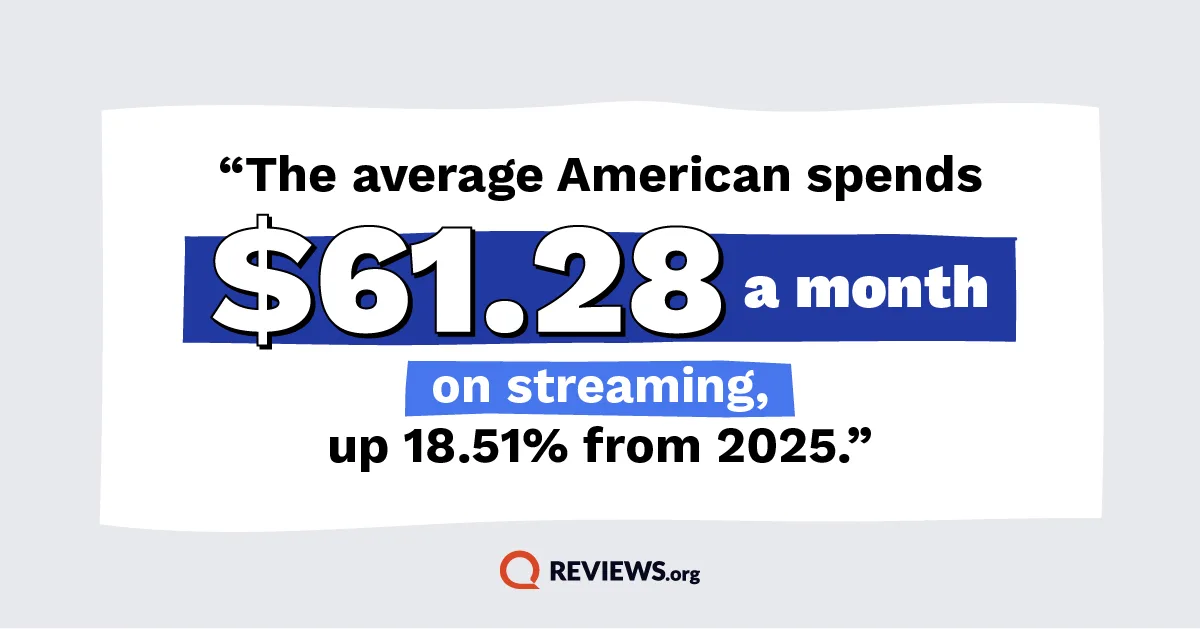
Streaming saw the steepest price increase of any category. The average reported spend jumped to $61.28 per month — up 18.51% from $51.71 in 2025. Median spending rose from $31.41 to $50.00. This could come from price hikes hitting broadly or heavy subscribers stacking multiple platforms.
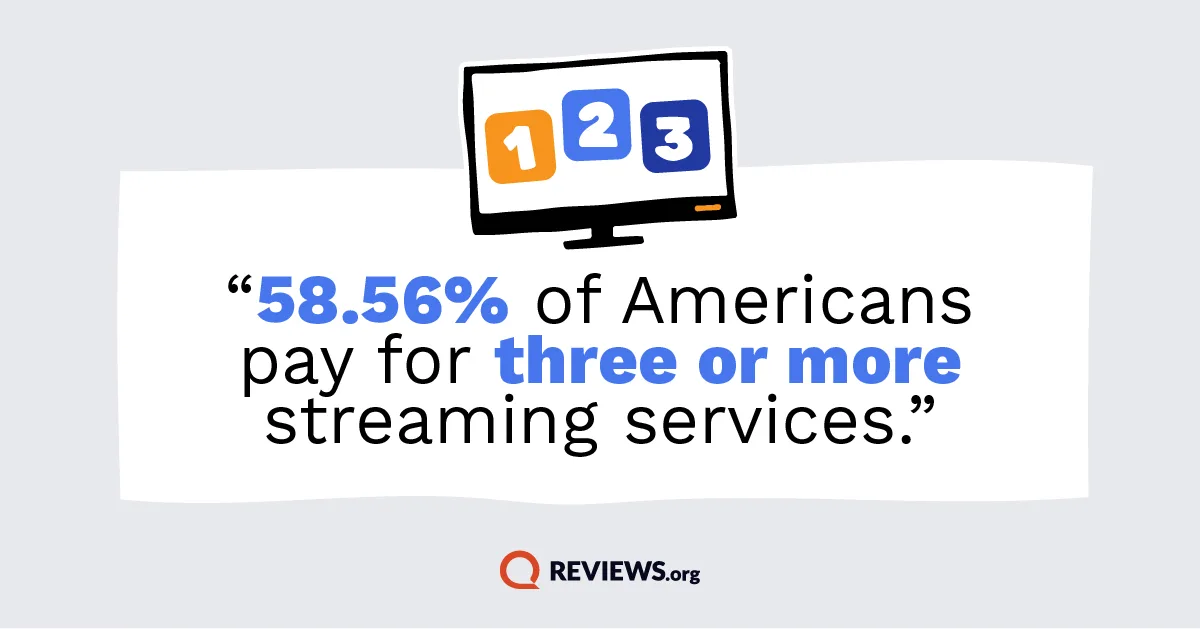
81% of respondents use at least one paid streaming service, and 59% subscribe to three or more — roughly three services on average.
Streaming behaviors 2026 vs. 2025: Share of viewers who agree on costs, ad-supported plans, and fatigue
Subscribers are adapting to the changing prices:
- 57% of respondents say their monthly streaming costs are too high – down from 58% in 2025
- 57% say they chose a cheaper, ad-supported tier — up from 55% in 2025
- 52% signed up for a service just to watch a single show or movie
- 44% have canceled and later resubscribed
- 43% of respondents pay for a streaming service they rarely watch, up from 32% in 2025
Streaming fatigue is growing too:
- 37% of respondents agreeing they feel fatigued by the sheer volume of services and content, up from 31%.
- 46% said they plan to cut at least one streaming subscription in the next six months
Ways to save in 2026
Your costs vary depending on where you live and what you actually use, but there's room to cut in every category.
1
Reduce your internet bill
Check whether 5G home internet or fiber has become available in your area — both tend to be competitively priced.
If you're locked into a cable plan, call your provider and ask about current promotions. You can also downgrade your speed tier if you're paying for more bandwidth than your household actually needs — most families streaming on a few devices don't need a gigabit connection.
2
Switch to an MVNO
Switching from a Big Three carrier to an MVNO like Visible, Mint Mobile, or Tello saves about $130 per year per line. If you're among the 11% who rely on Wi-Fi, look at lower-data or prepaid plans instead of paying for unlimited data you aren't using.
3
Ditch cable TV
TV is the largest single expense, and the easiest lever to pull is ditching traditional cable for a live TV streaming service. You'll get a similar channel lineup with more flexibility and fewer fees.
If you don't need live sports or news, an over-the-air antenna paired with a few streaming services can cut your TV bill dramatically.
Either way, audit your add-on channels and premium tiers — many cable and satellite customers are paying for packages they signed up for years ago and forgot about.
4
Rotate your streaming services
Streaming is where the smallest changes can add up. If you’re among the 43% paying for a service you rarely open, cancel it. Keep two to three core services that you actually watch and rotate the rest. Sign up for a month to binge a specific show, then cancel.

Reviews.org calculated the cost of staying connected using provider pricing data and a survey of 1,000 U.S. adults in October 2026, estimating average monthly costs for internet, mobile, TV, and streaming, then projecting these costs over 60 years.
Internet rates are averaged across major cable, fiber, DSL, satellite, and 5G providers. Mobile figures include separate averages for postpaid plans from the Big Three carriers (AT&T, T-Mobile, and Verizon) and top MVNO or prepaid carriers in the U.S. TV figures reflect average cable, satellite, and live TV costs. Streaming costs are based on survey responses.
Year-over-year changes compare 2025 and 2026 data. All figures are in USD and are not adjusted for inflation. The 2025 figures come from last year's report.
Reports from previous years

Related Articles

Why an Unpaid Internet Bill Can Get You Turned Down by a New Provider
Unpaid WiFi bills can make it hard to get a new ISP. If you have...
Reviews.org State of Consumer Media Spending 2026
American households now spend $283.39 a month on internet, mobile, TV, and streaming. The average...

Your Kid Is Confiding in an AI Chatbot. Do You Know What It’s Saying Back?
AI chatbots aren’t going anywhere. How can kids engage with them while protecting their mental...

How Reliable Is Metro by T-Mobile? A Look at Coverage, Speed, and 5G
Metro by T-Mobile is more affordable than major carriers and provides uncompromised, reliable 5G coverage.


