How long do Americans really keep their phones?
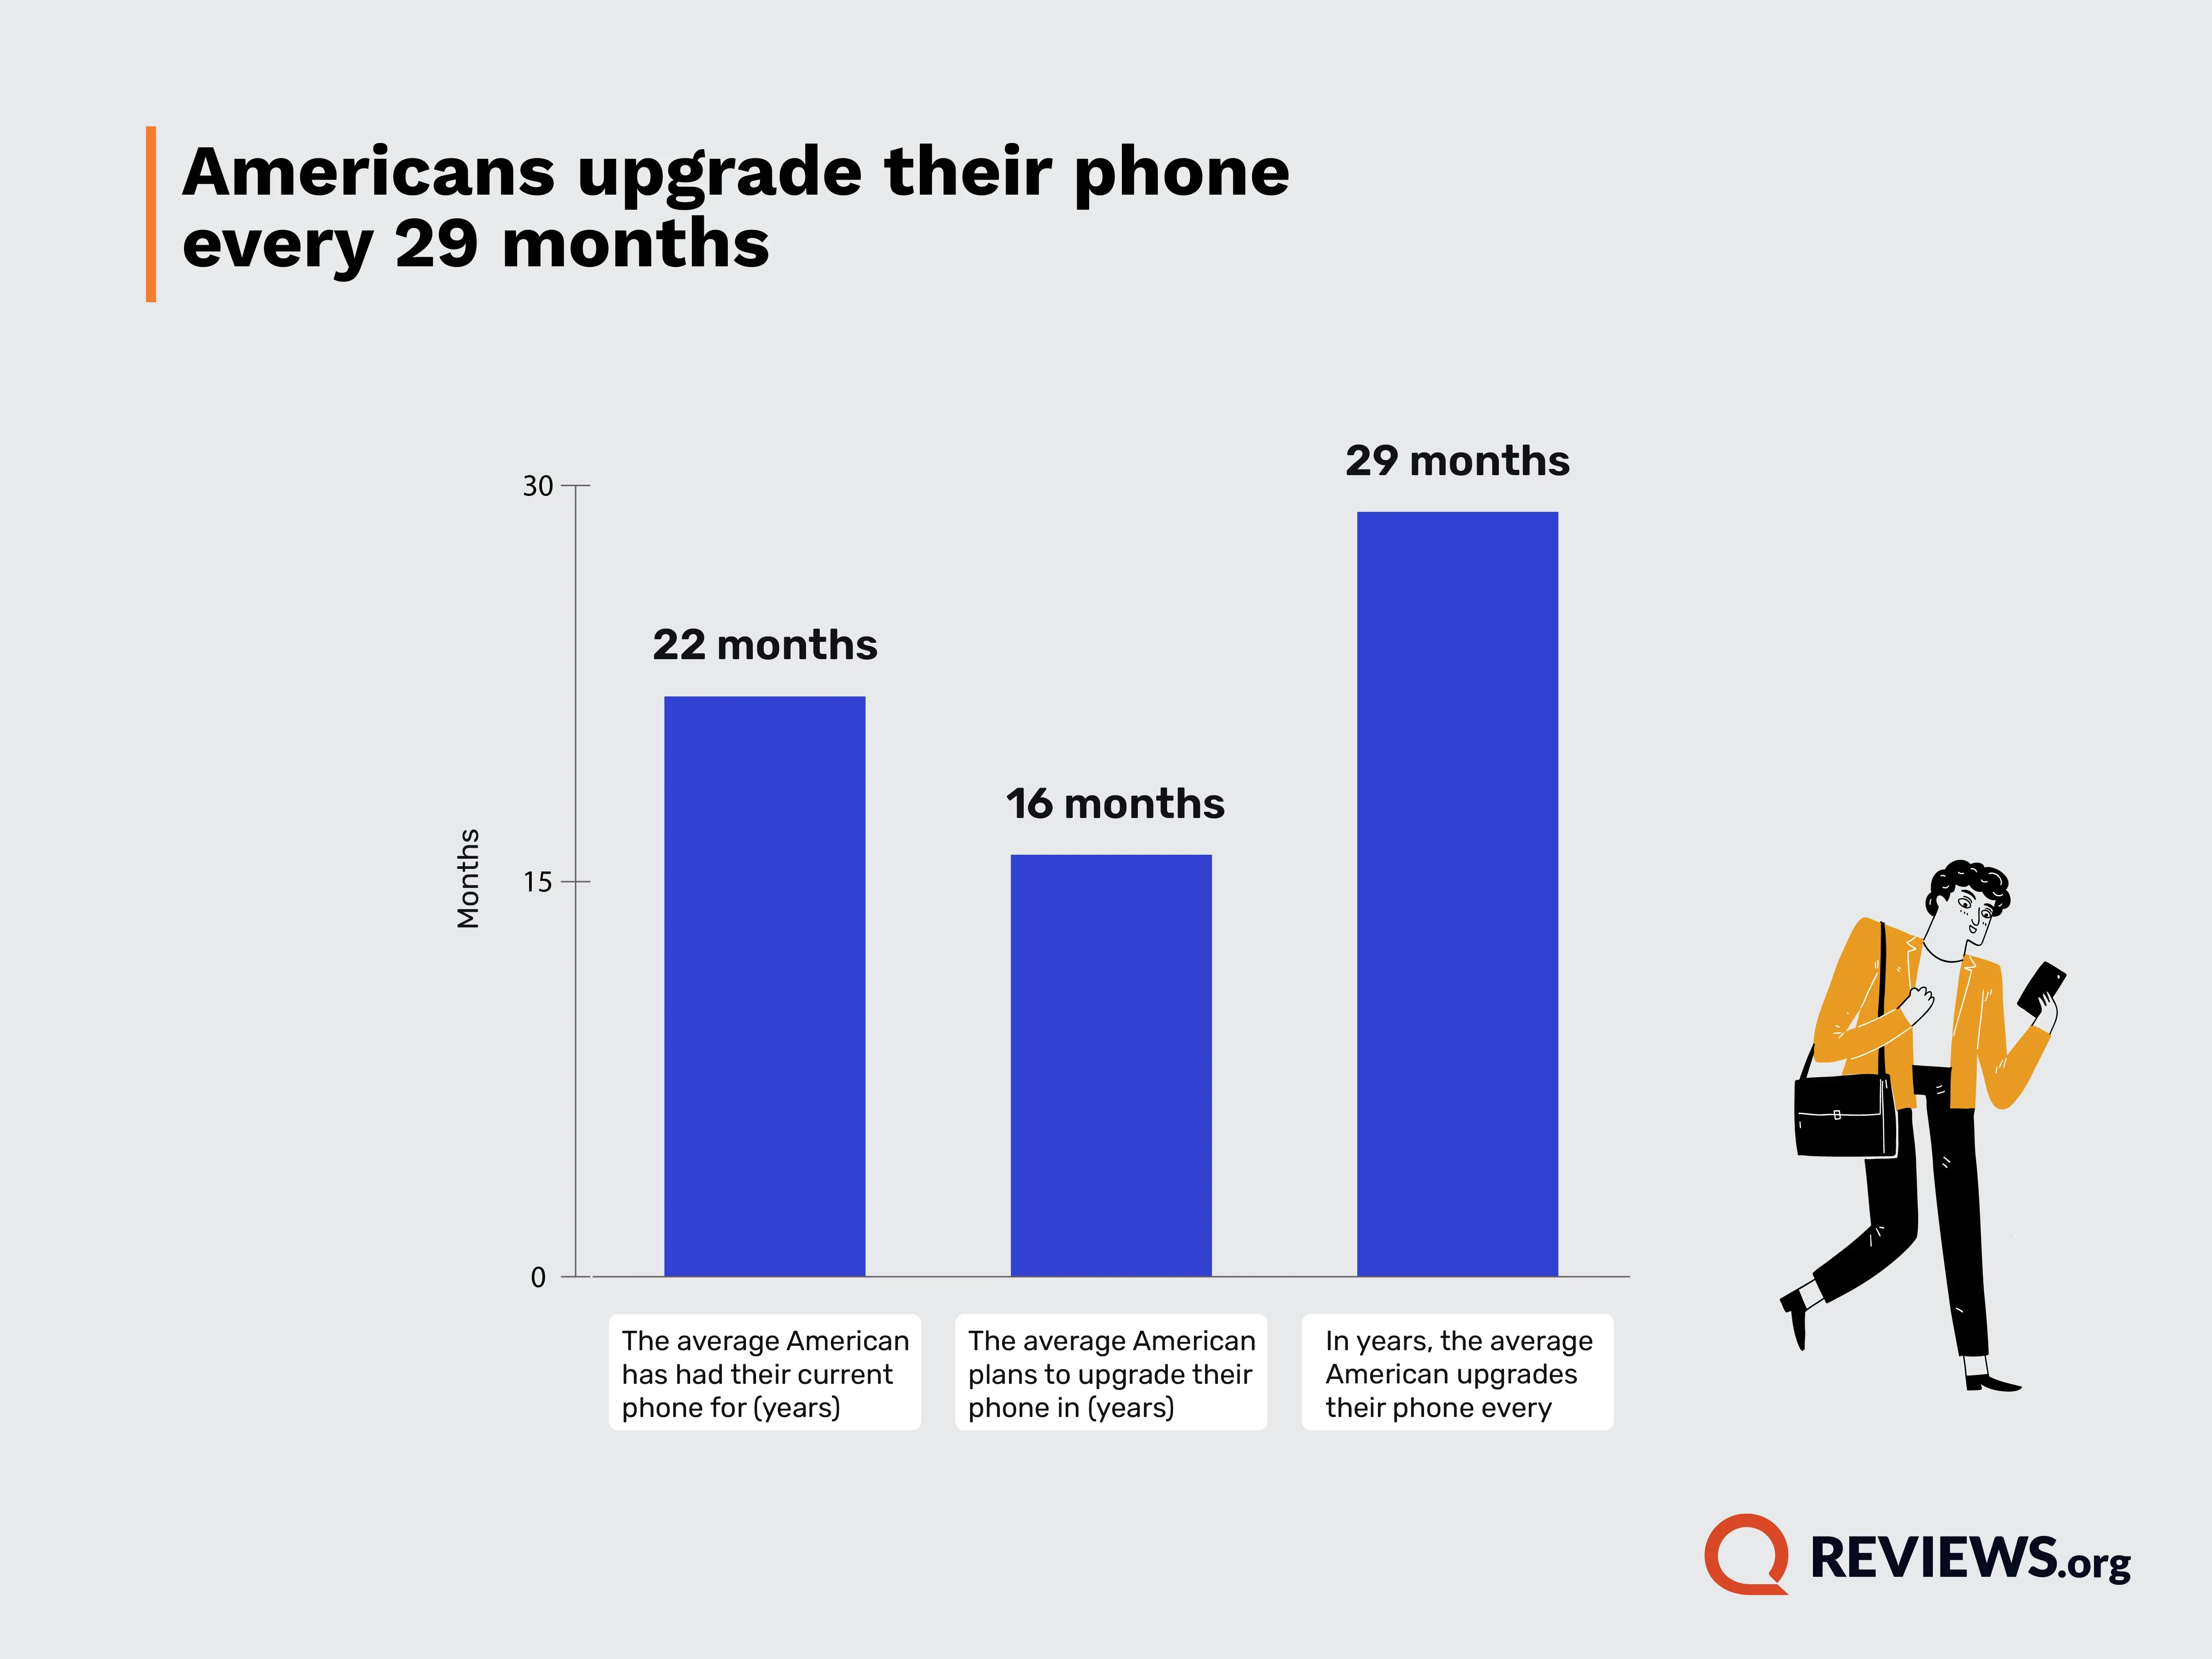
To find out how long Americans keep their phones, we asked survey respondents a series of questions such as how long they’ve had their current phone, when they next want to upgrade, and how often they usually upgrade their phones when recalling their actual upgrade frequency. Here are the results, as of the time of the survey (September 8, 2025):
- The average user says they’ve kept their current phone for 22 months
- The average user wants to upgrade their phone in 16 months
- 29% intend on upgrading their phone in the next 6 to 12 months
However, there’s a clear gap between intentions and behavior. Based on self-reported upgrade habits, the average American actually upgrades their smartphone about every 29 months.
Planned vs. Actual Upgrade Cycles
But why do Americans get new phones? Nearly 13% of respondents say they want to replace their phone because it’s broken or lost, but it’s not the most common reason. The three most popular reasons include: Faster performance (22%), followed by battery issues (18%), and wanting new features (13%).
While wanting new features is a matter of individual preference, factors like slowed performance and battery issues are often unavoidable. A smartphone battery only lasts for two to three years, since the phone’s capacity to hold a charge reduces over time as a result of physical and chemical changes in the battery.
What is the main reason you want to upgrade your phone?
Reason for wanting to upgrade | % of respondents
|
| Faster performance | 21.90%
|
|---|
| Battery issues | 18.40%
|
|---|
| New features | 13.00%
|
|---|
| Broken or lost phone | 12.80%
|
|---|
| Desire to own the newest phone model | 7.80%
|
|---|
| Compatibility with new technologies (i.e. 5G networks) | 7.60%
|
|---|
| Insufficient storage space | 7.50%
|
|---|
| Trade-in deals or better contract options | 5.70%
|
|---|
| Better camera | 4.30%
|
|---|
| Other | 1.00% |
|---|
Only around 6% of users want to upgrade because of a trade-in deal or better contract option, which is interesting considering that major cell phone carriers offer free or discounted phone deals via a trade-in. For example, some T-Mobile plans include the option to upgrade your phone every year or every two years.
These deals come with some caveats. When you trade in your phone, you get a partial discount on the price of the new phone, and then you can either pay the rest upfront or split the remaining cost over a set number of months. However, in the case where a carrier offers to either fully cover the phone or pay the remainder, the cost is actually split into monthly credits over a period of time until the phone is fully paid off. This means you end up getting locked into a phone plan, perhaps one you don’t really need or one that is more expensive than average.
“I don’t subscribe to the ritual of getting every new release as soon as it’s out,” Andreas Rivera, a Google Pixel 7a owner, tells Reviews.org. Rivera previously had a Pixel 3 phone for five years, and only upgraded after his Pixel 3 stopped working. “I’ve never really been swayed by the incremental hardware releases or upgrades, which usually seem prosaic and non-essential.”
How much do phones cost?
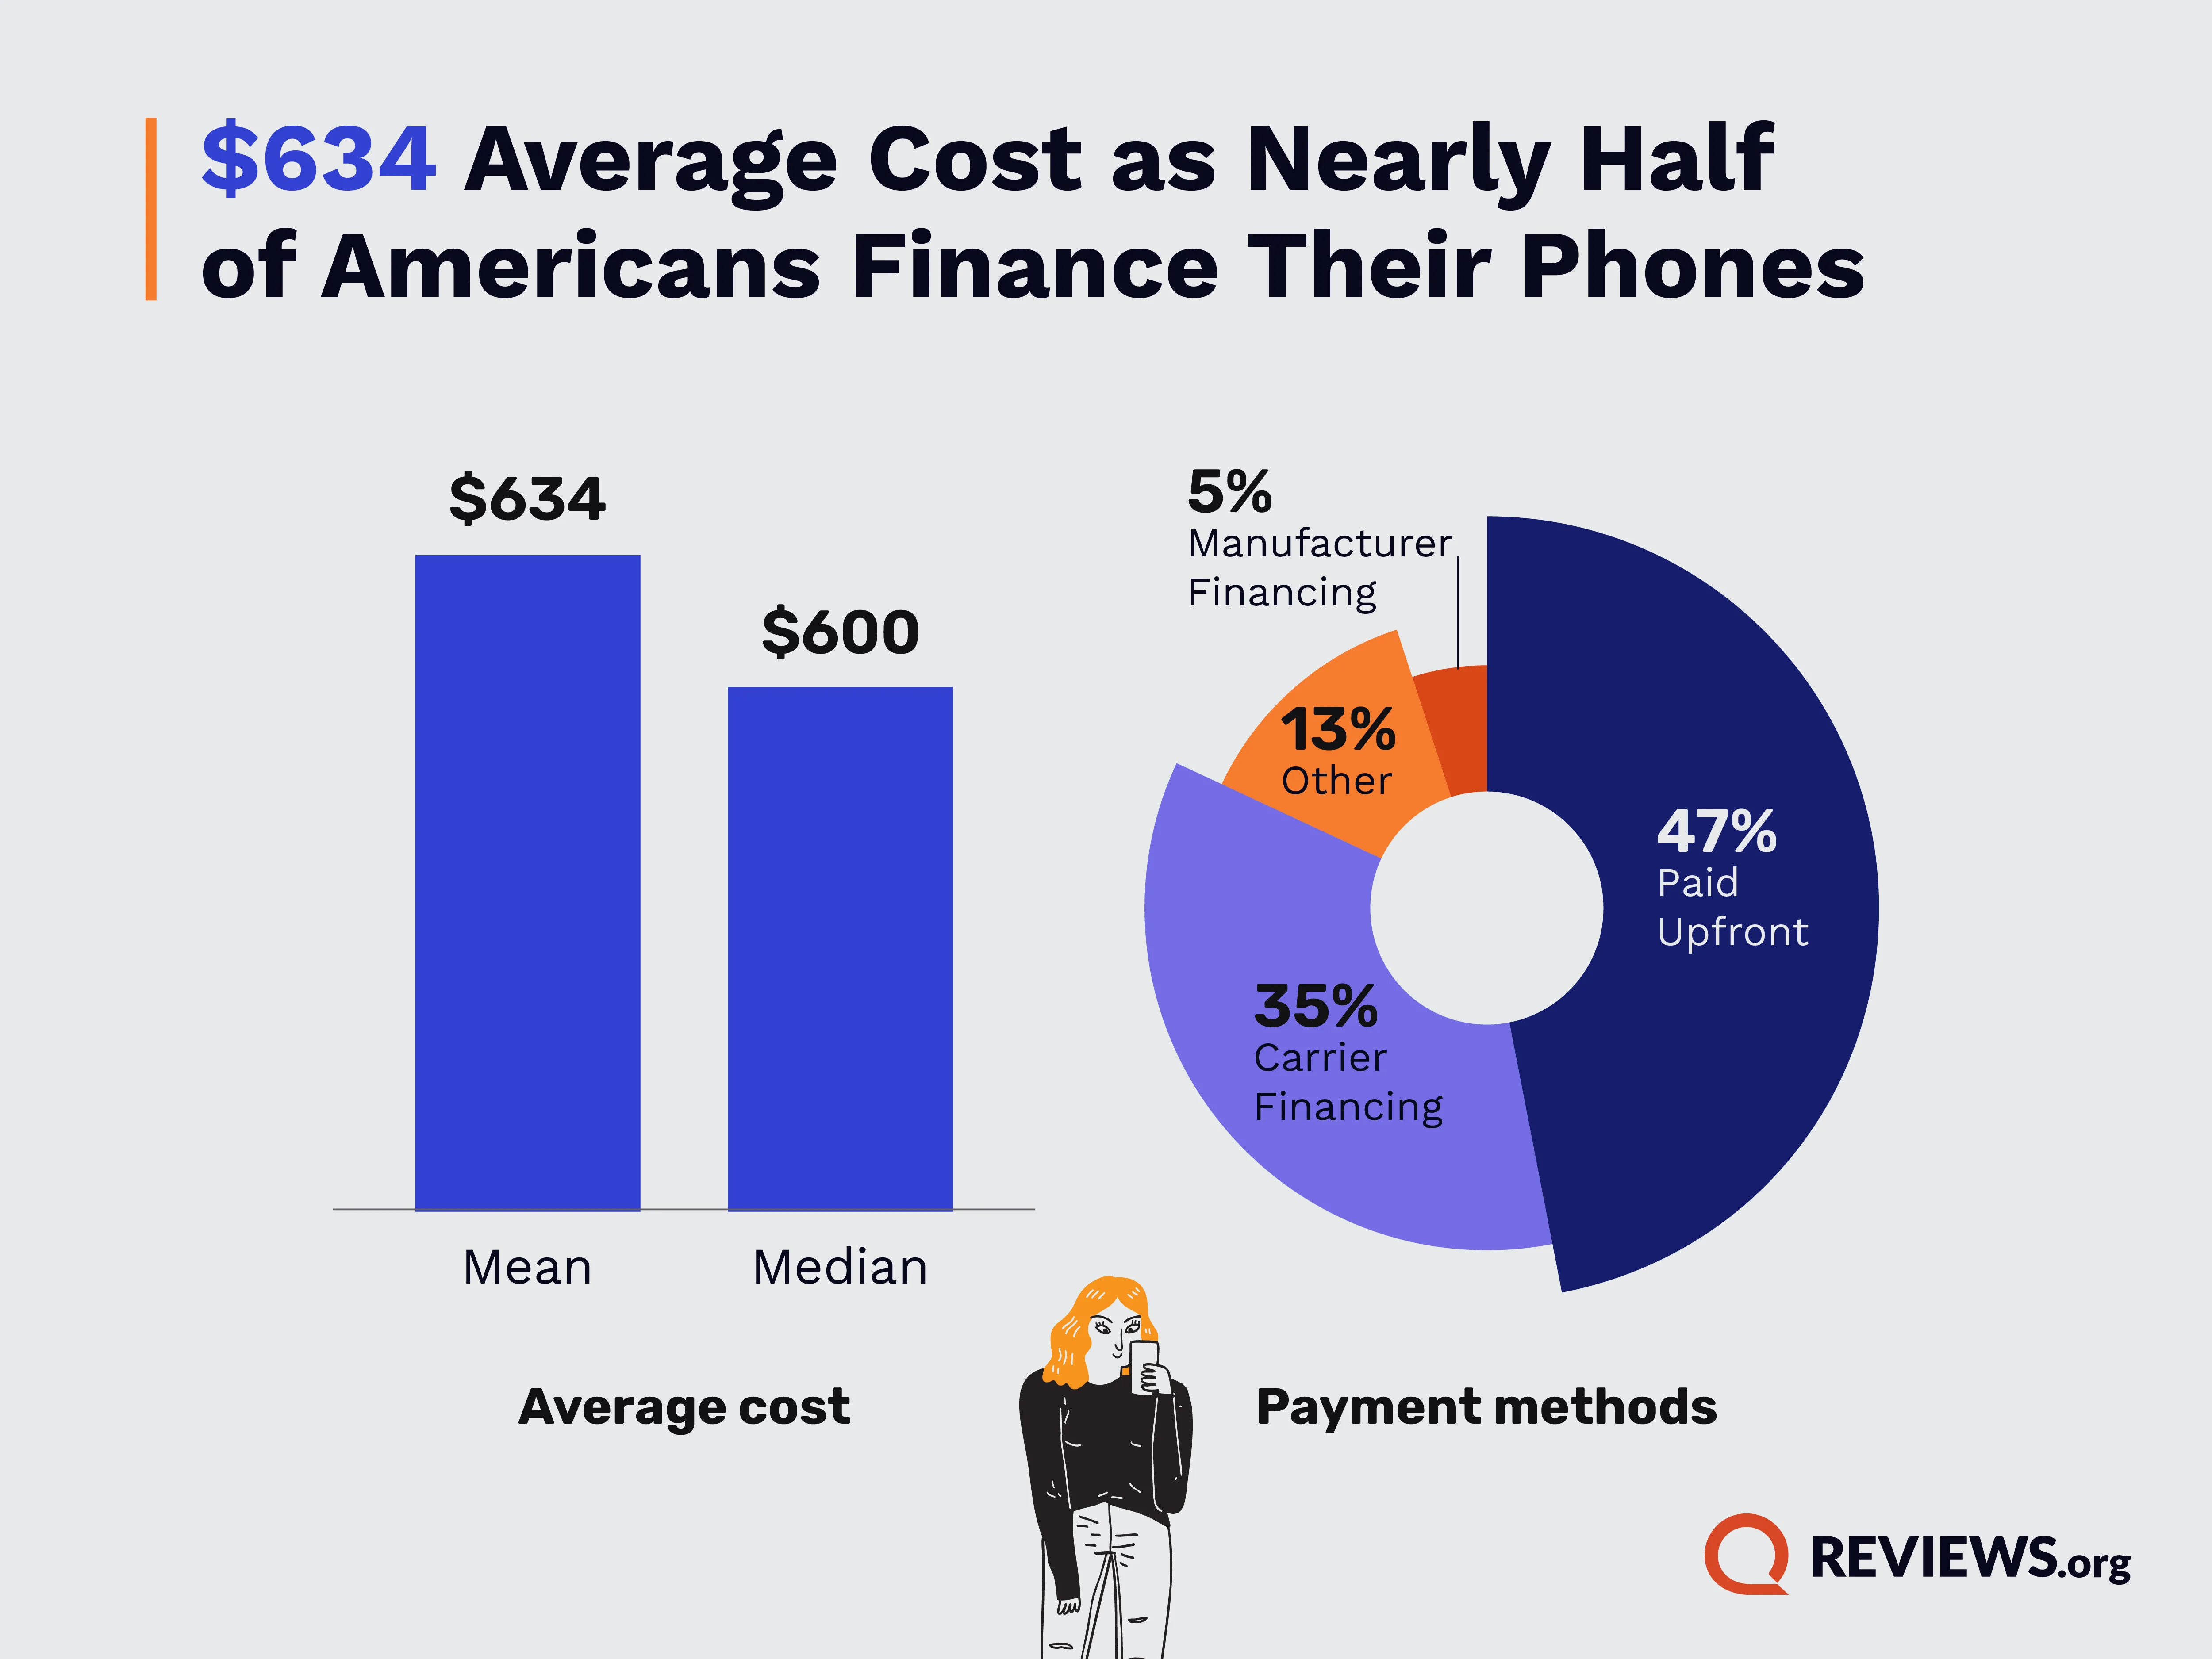
According to our survey, the average American pays just $634.35 for their phone. This is significantly less than current retail prices of the latest premium phones:
- An Apple iPhone 17 Pro costs $1099
- A Samsung Galaxy S25 Ultra costs $1419.99
- A Google Pixel 10 Pro costs $999.
Even though the average phone cost is pricey, 47% of survey respondents report paying the full cost up front. The next most popular method of payment is financing: 36% of survey respondents finance their smartphone through their cell phone carrier.
Some 5% of survey respondents opt to finance their phone directly with the manufacturer, like Apple or Samsung. Ryan Parker, an avid iPhone user, recently decided to take advantage of a trade-in deal via the Apple Card to score an iPhone 17 at a reduced monthly cost with no interest. “Every year a new iPhone comes out, the value of my current phone goes down, whether I keep it in good condition or not,” Parker tells Reviews.org in an interview. “It's like I'm ‘cashing in’ on my current phone now while it's still functional and worth something, rather than risk losing all its value.”
Payment types | % of respondents
|
| "Paid upfront, in full" | 46.80%
|
|---|
| Financed through carrier (i.e. T-Mobile or Verizon) | 35.40%
|
|---|
| Financed through manufacturer (i.e. Apple or Samsung) | 5.30%
|
|---|
| Gifted | 5.10%
|
|---|
| Hand me down | 2.30%
|
|---|
| Secondhand | 0.80%
|
|---|
| Refurbished | 2.20%
|
|---|
| None of the above | 1.50%
|
|---|
| Other | 0.80% |
|---|
Apple vs. Android: Smartphone Satisfaction
We also asked survey respondents to indicate what type of smartphone they own and how satisfied they are with their device. As indicated in the table below, Apple iPhone customers make up 48% of the population, whereas Android customers make up 52% of the population.
What type of smartphone do you have?
Device type | % of respondents
|
| Apple iPhone | 47.60%
|
|---|
| Android device | 52.10%
|
|---|
| Other | 0.30% |
|---|
The most commonly owned iPhone model is the iPhone 13 (10%), followed by the iPhone 14 (8%), then the iPhone 11 (7%). The most popular Android model is the Samsung Galaxy S9 (10%), followed by the Samsung Galaxy S10 (6%), and the Samsung Galaxy S24 Ultra (6%).
How satisfied are you with your current smartphone?
Satisfaction by device platform | Average satisfaction score
|
| Android | 3.98
|
|---|
| iPhone | 4.16 |
|---|
Using a scale from 0 to 5—with 0 being “Extremely dissatisfied” and 5 is “Extremely satisfied”—we asked respondents to rank their satisfaction with their current smartphone. On average, iPhone users indicated higher satisfaction than Android users, with an average satisfaction score of 4.16 for iPhone users, and 3.98 for Android users.
iPhone 15 users report the highest satisfaction (a full 5 out of 5 score), while newer Samsung Galaxy models trail behind at 3.6 out of 5—highlighting Apple’s edge in consumer happiness.
Older iPhones, like the 13 Pro Max and XR, still rate highly–4.72/5 and 4.56/5, respectively. There could be multiple reasons for these high ratings for older models, such as a cheaper price so people are more likely to buy them, specific features that disappeared in later models, or even their durability.
Newer Android flagships lag behind, with the Samsung Galaxy S23 Ultra getting a score of just 3.58/5.