Best cell phone plans
Compare top cell phone plans by provider
Provider | Best for | Our plan pick | Plan price (1 line) | Details |
| Best deal for new customers | Unlimited Data Plan | $15/mo. for first three months | View Plan |
|---|
| Best budget plan | Unlimited Text, Talk, and Data Plan | $25/mo. | View Plan |
|---|
| Bundle deal | Unlimited Data Plan | $45/mo. | View Plan |
|---|
| Best bundle alternative | 500Mbps internet + Unlimited mobile | $50/mo. | View Plan |
|---|
| Coverage | $25 Unlimited Plan | $25/mo. | View Plan |
|---|
| Best family plan | Unlimited Basic | $75/mo.
(3 lines) | View Plan |
|---|
Data effective as of post date. Offers and availability vary by location and are subject to change.
Pro Tip: Whether you’re upgrading your phone or looking for a better deal, consider bundling your services for savings. Explore our top picks for internet and mobile bundles.
Americans spend at least 3 hours on their phone. Here’s the breakdown by generation.
In our recent analysis of internet screen time statistics, we found the average American spends 3 hours and 14 minutes on their phones alone—and they get far more screen time when considering other devices like tablets or desktop and laptop computers.
Which generation spends the most time on screens?
Gen Z leads in screen time for both smartphones and desktops (though millennials spend the same time on the computer, and aren’t far behind at all when it comes to smartphone use).
Screen Time By Generation
Generation | Smartphone | Desktop | Laptop | Tablet | Connected TV
|
| Baby Boomers | 2h 8m | 1h 18m | 1h 44m | 0h 46m | 3h 33m
|
|---|
| Generation X | 3h 5m | 1h 38m | 2h 10m | 0h 51m | 3h 12m
|
|---|
| Millennials | 3h 57m | 2h 4m | 2h 24m | 1h 1m | 3h 4m
|
|---|
| Generation Z | 4h 6m | 2h 4m | 2h 33m | 1h 34m | 2h 55m |
|---|
Gen X stands firmly in third for phone time, logging nearly an hour less than Millennials and an hour more than Boomers. Overall, boomers spend the least amount of time on both smartphones and desktop computers.
Generation | Smartphone (Daily) | Desktop computer (Daily)
|
| Gen Z | 4h 6m | 2h 4m
|
|---|
| Millennials | 3h 57m | 2h 4m
|
|---|
| Gen X | 3h 5m | 1h 38m
|
|---|
| Boomers | 2h 8m | 1h 18m |
|---|
Since most of us split our time online between both phone and internet, it’s worth looking at computer time usage as well. The differences in desktop use aren’t nearly as drastic, with most Americans averaging between 1-2 hours with the younger generations at the high-end, Gen X in the middle, and Boomers at the low end.
Daily phone pick ups by generation
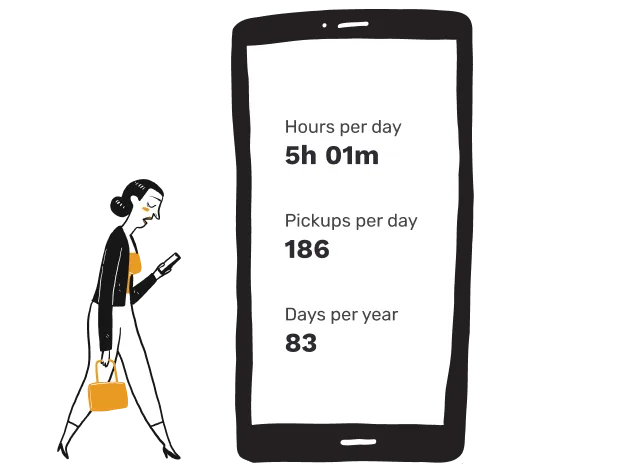
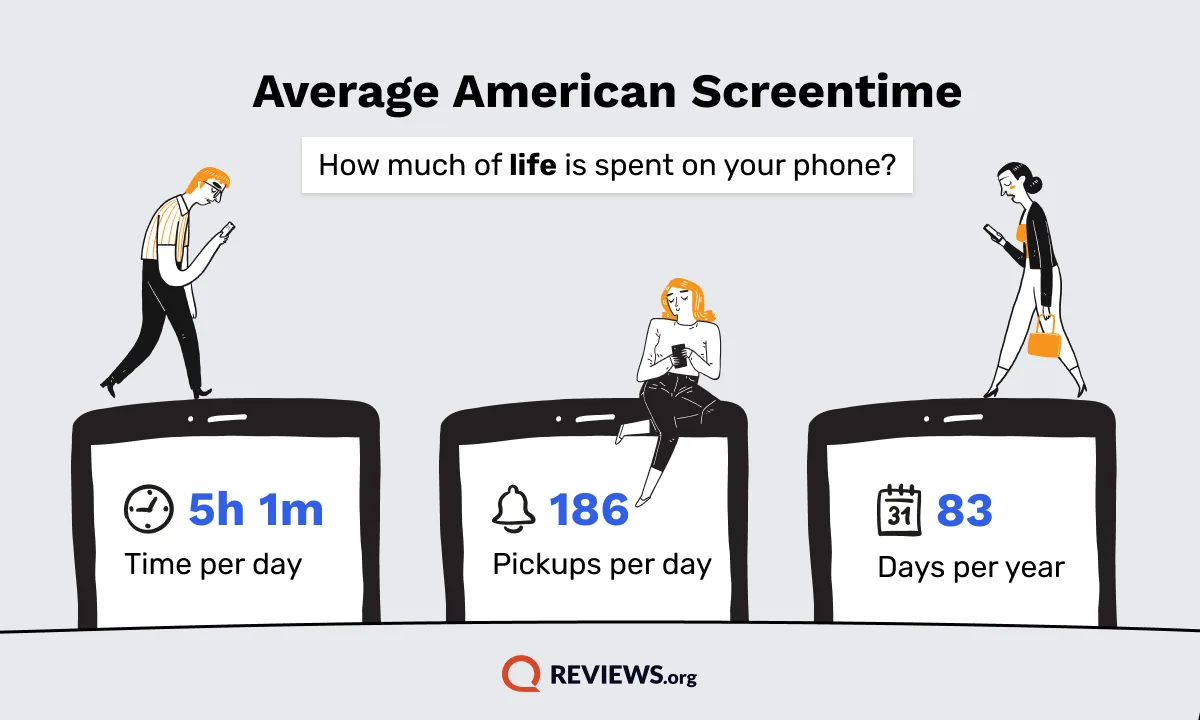
On average, the American population averages 12 hourly phone pickups and 186 daily pickups.
Despite Gen Z spending more time on their phones (double that of the Boomers), the youngest adult generation has far fewer average phone pickups per hour and day—implying that when they are on their phone, they stay on for much longer.
Generation | Average Hourly Pickups | Average Daily Pickups
|
| Gen Z | 7 | 112
|
|---|
| Millennials | 12 | 186
|
|---|
| Gen X | 12 | 196
|
|---|
| Boomers | 14 | 224
|
|---|
| Overall | 12 | 186 |
|---|
Generation most likely to be addicted to their phone
Regardless of generation, nearly half of every age bracket considers themselves addicted to their phones. With that said, Millennials self-report the highest percentage at 47%, and the other generations hovering just above 45%.
Do you consider yourself addicted to your phone?
Generation | Percentage that said yes
|
| Millennials | 47.30%
|
|---|
| Boomers | 45.50%
|
|---|
| Gen X | 45.30%
|
|---|
| Gen Z | 45.10% |
|---|
Which generation is most likely to check notifications the quickest?
Gen Z stands out for being the least likely to check their notifications quickly (meaning within 5 minutes), but over three-fourths of them still do. Millennials are the most likely to check their phones quickly at 87%, followed by the boomers at 85%, and Gen X isn’t far behind at 83%.
Do you check your phone within 5 minutes of getting a notification?
Generation | Percentage that said yes
|
| Gen Z | 77.40%
|
|---|
| Millennials | 87.30%
|
|---|
| Gen X | 82.90%
|
|---|
| Boomers | 85.50% |
|---|
Generation most anxious after losing their phone
When it comes to anxious attachment to their phones, boomers reported the highest rate. Nearly three fourths of boomers feel anxious after losing their phone compared to the roughly 2/3rds of Millenials and Gen Xers, and just over half of Gen Z reported being anxious about losing their phones.
Generation Most Anxious After Losing Their Phone
Generation | Percentage that said yes
|
| Gen Z | 52.80%
|
|---|
| Millennials | 66.70%
|
|---|
| Gen X | 65.70%
|
|---|
| Boomers | 74.80% |
|---|
Knowing we want a new phone may make the loss of an old one less of an issue: zoomers are the most likely to upgrade their phone soon, whereas boomers are the least likely.
Which generation is most likely to upgrade their phone?
Overall, over a third (37%) of Americans report upgrading their phone in the last year.
Zoomers are most likely (by far) to upgrade their phones, followed by Gen X and Millenials. Still, over a third of baby boomers plan to upgrade their phone, too.
Generation Most Likely To Upgrade Their Phone
Generation | Percentage that said yes
|
| Gen Z | 43.70%
|
|---|
| Millennials | 35.90%
|
|---|
| Gen X | 38.30%
|
|---|
| Boomers | 34.80% |
|---|
On average, Americans keep their phones for 2.5 years (about every 29 months) rather than updating annually (a common misperception, largely based on marketing from bigger companies like Apple). People say they typically keep their current phone for about 22 months and want to upgrade in 16 months on average. However, the average American actually upgrades about every 29 months, despite planning to upgrade much sooner.
The top reasons for wanting to upgrade are for faster performance (22%), battery issues (18%), and new features (13%). Only about 8% say getting the newest model is their main reason, and around 6% upgrade primarily because of trade-in or contract deals. Americans pay about $634 on average for a phone, and 47% pay that upfront, so more frequent upgrades end up becoming costly considerations.
And if you feel like the costs for phones (along with internet and streaming prices) are becoming too much, you’re not alone: our recent survey analysis shows that Americans may spend upwards of $200,000 on these services in a lifetime. Of course, you always have options for reducing costs by finding a better cell phone plan or a cheaper internet provider.
Though our relationship with cell phones continues to develop and shift as the years go on, there’s no reason to believe they’re going away anytime soon, even with the advent of AI tech—if anything, we’re more likely to integrate our cell phones and their AI features into daily lives, blurring further the line between being online or offline.