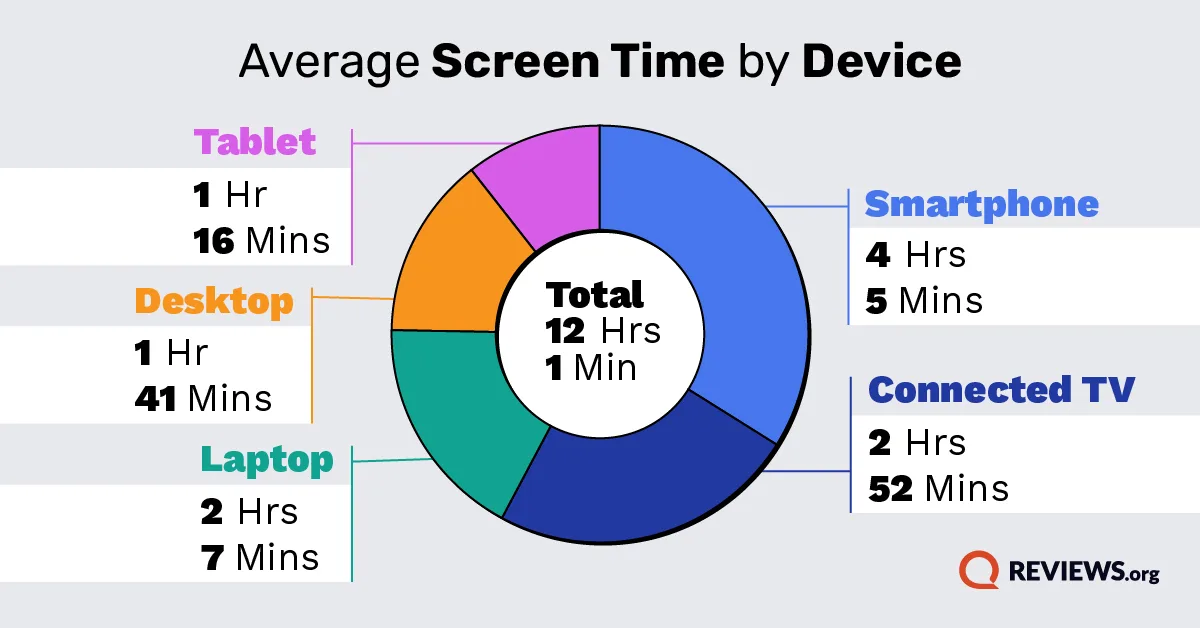
In 2026, Americans logged a daily average of 12 hours and 1 minute of screen time, accumulating to nearly half a day in front of screens. Broken down by device, smartphones take up the most screen time at 4 hours and 5 minutes per day.
Broken down by generation, Gen Z spends the most time on screens at 15 hours and 19 minutes per day. In our survey, we asked 1,000 Americans about where their screen time goes, which devices dominate, and how these habits differ by generation.
Americans spend about 12 hours a day on screens
With a daily screen time average of 12 hours and 1 minute, Americans spend more waking hours on their screens than off. If we consider screen time as work, then we put in four hours of overtime, seven days a week, and we do it for free.
Smartphones, the screens practically always at our sides, take up more than 4 hours of that daily screen time. Some of that time likely overlaps with our other screens rather than standing alone, since many of us probably scroll on our phones while watching nearly three hours of TV every day, or while logging more than two hours on a laptop. Regardless, it’s a decent chunk of our time spent on a smartphone screen.
Device | Average time per day |
| Smartphone | 4h 05m |
|---|
| Connected TV | 2h 52m |
|---|
| Laptop | 2h 07m |
|---|
| Desktop | 1h 41m |
|---|
| Tablet | 1h 16m |
|---|
| Total | 12h 01m |
|---|
Tablets tack on an extra hour and 16 minutes during our day, filling in the screenless gaps. Simply put, we’re spending a significant amount of time on screens. But what are Americans doing with all that screen time?
Email, shopping, and social media are the most common online activities
More than 90% of Americans use screens for email and online shopping, and social media is close behind at nearly 89%. The majority of time is spent communicating, consuming, or both simultaneously.
Social media has blended online communicating, shopping, and browsing into one convenient platform: you can email a coworker, buy furniture from across the world, and swipe through potential dates, all without switching screens. Usually, it's just your phone doing the job.
Online activity | Share of Americans who do it |
| Email | 92.60% |
|---|
| Online shopping | 90.61% |
|---|
| Social media browsing | 88.92% |
|---|
| Streaming TV | 84.68% |
|---|
| Streaming movies | 83.98% |
|---|
| Streaming music | 80.54% |
|---|
| Online gaming | 66.25% |
|---|
| Work | 62.15% |
|---|
| Listening to podcasts | 57.94% |
|---|
| Schoolwork | 30.16% |
|---|
Streaming has gone fully mainstream, with four out of every five Americans likely to stream TV, movies, or music, so screens are now commonly associated with entertainment and leisure.
And while online gaming isn't as popular with the general population as streaming, gaming still beats out the share of people who work on screens (66% vs. 62%). Meanwhile, 30% of Americans use screens for schoolwork.
Whether during work, school, or personal time, 57% of Americans say they listen to podcasts.
Now that we have an idea of the most popular screen activities, which of them actually take up the bulk of our time — work or entertainment?
Streaming TV, work, and social media take up the most time online
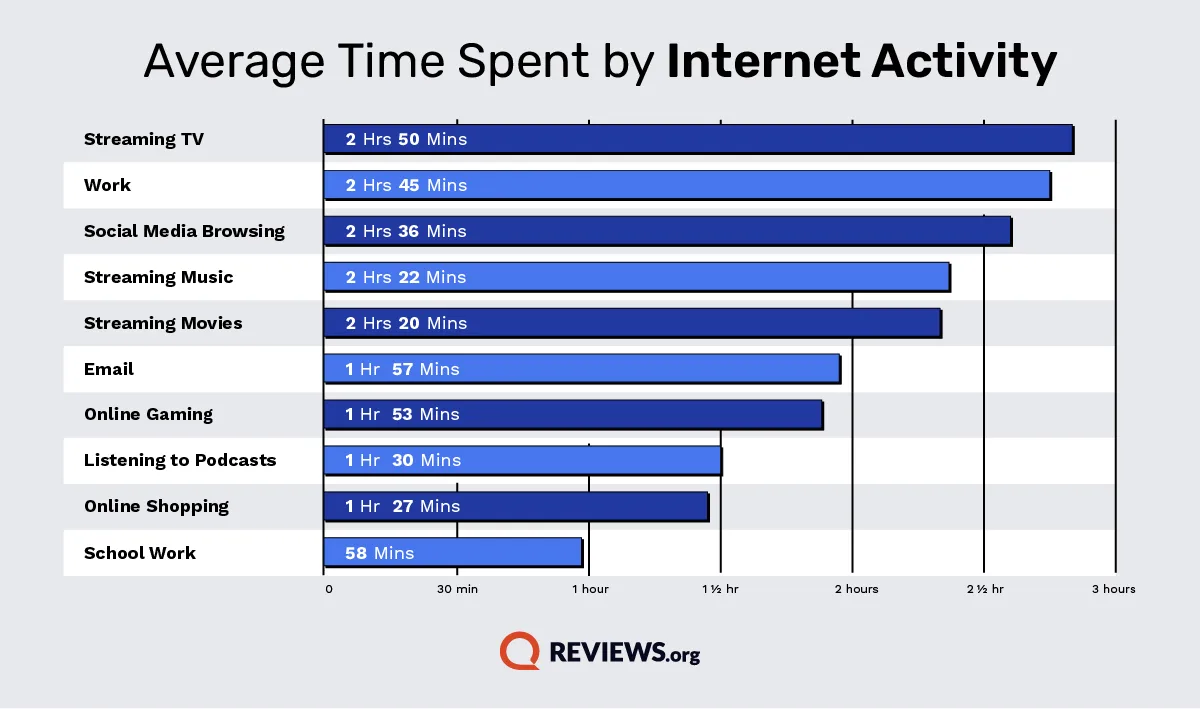
Americans log nearly 3 hours of streaming TV each day, and almost as much time working, followed by social media browsing and streaming music or movies, which are closer to two and a half hours every day.
Email was the most prevalent online activity, but it takes up far less time, at just under two hours a day. Schoolwork may be a bummer for students, but it only takes about 58 minutes per day on average to accomplish, about half of the average daily time spent gaming. Average time spent by online activity
Online activity | Average hours/day | Average time |
| Streaming TV | 2.83 | 2h 50m |
|---|
| Work | 2.75 | 2h 45m |
|---|
| Social media browsing | 2.60 | 2h 36m |
|---|
| Streaming music | 2.36 | 2h 22m |
|---|
| Streaming movies | 2.33 | 2h 20m |
|---|
| Email | 1.95 | 1h 57m |
|---|
| Online gaming | 1.88 | 1h 53m |
|---|
| Listening to podcasts | 1.51 | 1h 30m |
|---|
| Online shopping | 1.45 | 1h 27m |
|---|
| Schoolwork | 0.96 | 0h 58m |
|---|
While we may use screens for obligatory activities like work or school every day, the data shows we are certainly capable of balancing that time out with more entertaining activities like streaming.
Gen Z logs the most total screen time, while Boomers spend the most time on connected TV
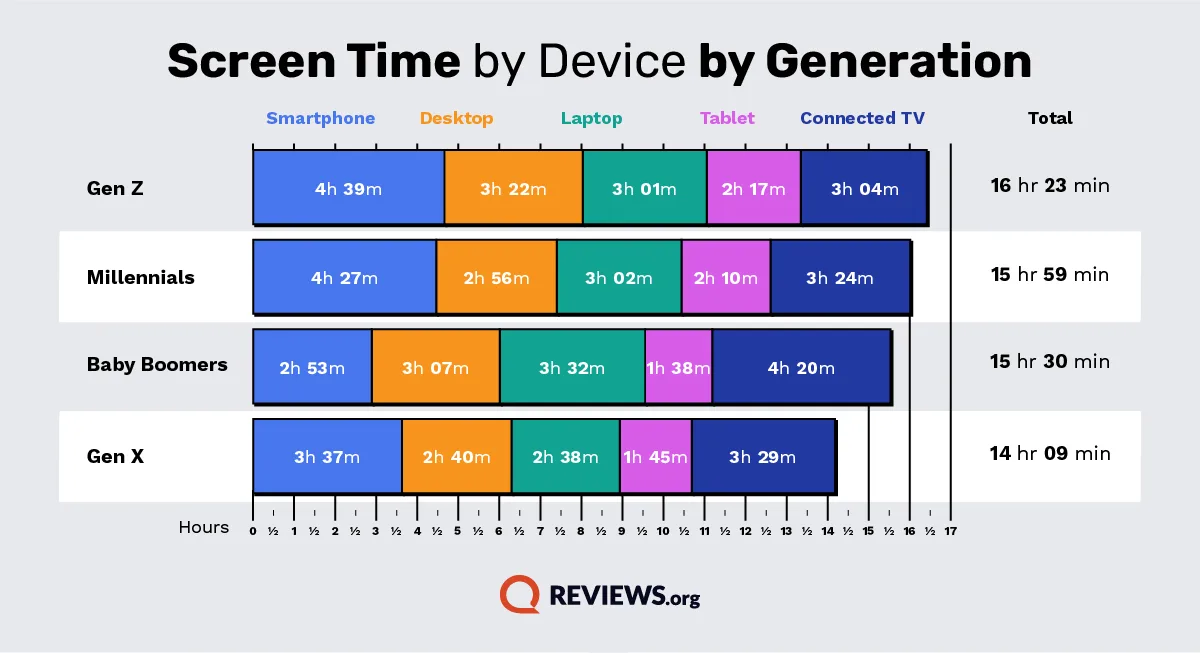
Gen Z and Millennials are well over the average American screen time of 12 hours and 1 minute. Gen Z spends over 15 hours a day looking at screens, and Millennials average just below 14 hours daily.
Meanwhile, Gen X logs an average of 11 hours and 11 minutes daily, slightly below the American average. Baby Boomers have the lowest logged screen time, but not by much: at 10 hours and 49 minutes daily, Baby Boomers still spend a significant amount of time staring at screens.
Generational totals are self-reported and may not equal the sum of individual device times due to overlapping device use.
Generation | Smartphone | Desktop | Laptop | Tablet | Connected TV | Total |
| Gen Z | 4h 39m | 3h 22m | 3h 01m | 2h 17m | 3h 04m | 15h 19m |
|---|
| Millennials | 4h 27m | 2h 56m | 3h 02m | 2h 10m | 3h 24m | 13h 55m |
|---|
| Gen X | 3h 37m | 2h 40m | 2h 38m | 1h 45m | 3h 29m | 11h 11m |
|---|
| Baby Boomers | 2h 53m | 3h 07m | 3h 32m | 1h 38m | 4h 20m | 10h 49m |
|---|



 3 min read
 Edited By