More than half of U.S. households have access to fiber internet, but availability lags in rural areas.
2026 Fiber Availability in the US: How Do Rural vs. Urban Areas Compare?
More than half of the U.S. has access to fiber. However, rural and remote areas don't get to share in the fiber love. Fiber is well-regarded as the best internet connection for its reliability, high speeds (for both downloads and uploads), and relatively low cost compared to other options like cable or DSL — but not everyone has access.
Still, we're optimistic: Overall coverage is up 6 percentage points, and this is the first year that more than half of America's households have access to fiber internet.
So which areas have seen the greatest gains in coverage over the past year?
We ranked every state by fiber availability using the latest FCC data along with internal availability data to find out where rural communities fall behind. We also looked into how the biggest provider shakeups, such as mergers with AT&T and Lumen Technologies (includes Century Link and Quantum Fiber) and Verizon and Frontier, could change the fiber map in 2026.
Key findings on national fiber availability:
- Rhode Island offers the greatest fiber availability out of all U.S. states, with 80% of households having access to fiber internet.
- Alaska offers the least fiber availability out of all U.S. states, with 9% of households having access to fiber internet.
- 75 million households have fiber access nationwide, accounting for 46% of the U.S.
- However, only 38% of U.S. households have access to fiber in rural areas.
National fiber availability trends for 2026
- National stats: 52% of households have fiber availability in 2026, up from 46% in 2025 (up 13% year over year)
- 50% of urban areas have fiber internet, compared to 40% of rural areas
- Rhode Island ranks No. 1 for overall fiber availability at 81%, while Alaska ranks last with only 13%
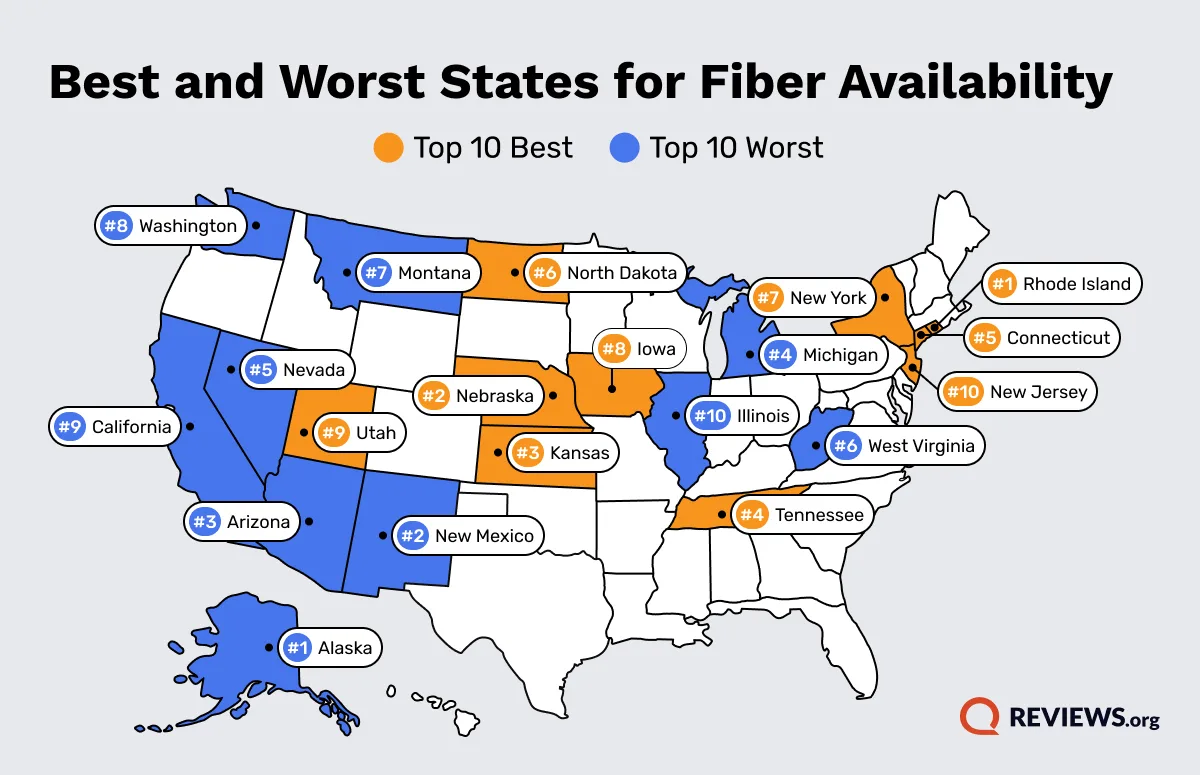
The 10 best states for fiber availability
Rhode Island stands out as a clear leader — it is the only state with over 80% coverage, beating the next closest states by more than 7%.
The rest of the top states in the list below have above 60% coverage, meaning the majority of people in those states have access to fiber internet plans.
In order for broadband to be considered by the FCC as having “advanced telecommunications capability,” it needs to deliver 100Mbps download speed and 20Mbps upload speed.
High-speed fiber internet isn't centralized in any one region of the U.S. — it's scattered across the country. But when we look at the states with the least fiber coverage, it becomes clear that rural populations, along with factors like rugged terrain and remote locations, play a significant role in where networks get built.
The 10 worst states for fiber availability
Unsurprisingly, due to its rugged landscape and rural and remote populations, Alaska ranks last for fiber availability by a wide margin — just 13%. That said, Alaska’s fiber internet coverage is improving.
With the exception of Utah (66%), Southwestern and Western states see far less than half of their populations covered:
- New Mexico (23%)
- Arizona (28%)
- Nevada (32%)
- Washington (36%)
- California (37%)
These states are prime candidates for fiber expansion.
California’s large area contains highly populated tech hubs and giant metros like San Francisco and Los Angeles, but it also has a sizable rural population of 2.3 million, which is 6% of the state’s population. With all that ground to cover—especially in more remote regions—along with the high cost to build fiber networks, and the existing competitive landscape of internet service providers, it takes well-funded initiatives from governments or communities to continue development in the Golden State.
On the northern and eastern sides of the U.S., Michigan (31%), West Virginia (35%), Montana (35%) and Illinois (37%) also lag behind in fiber network coverage.
Fiber availability by urban vs. rural data chart
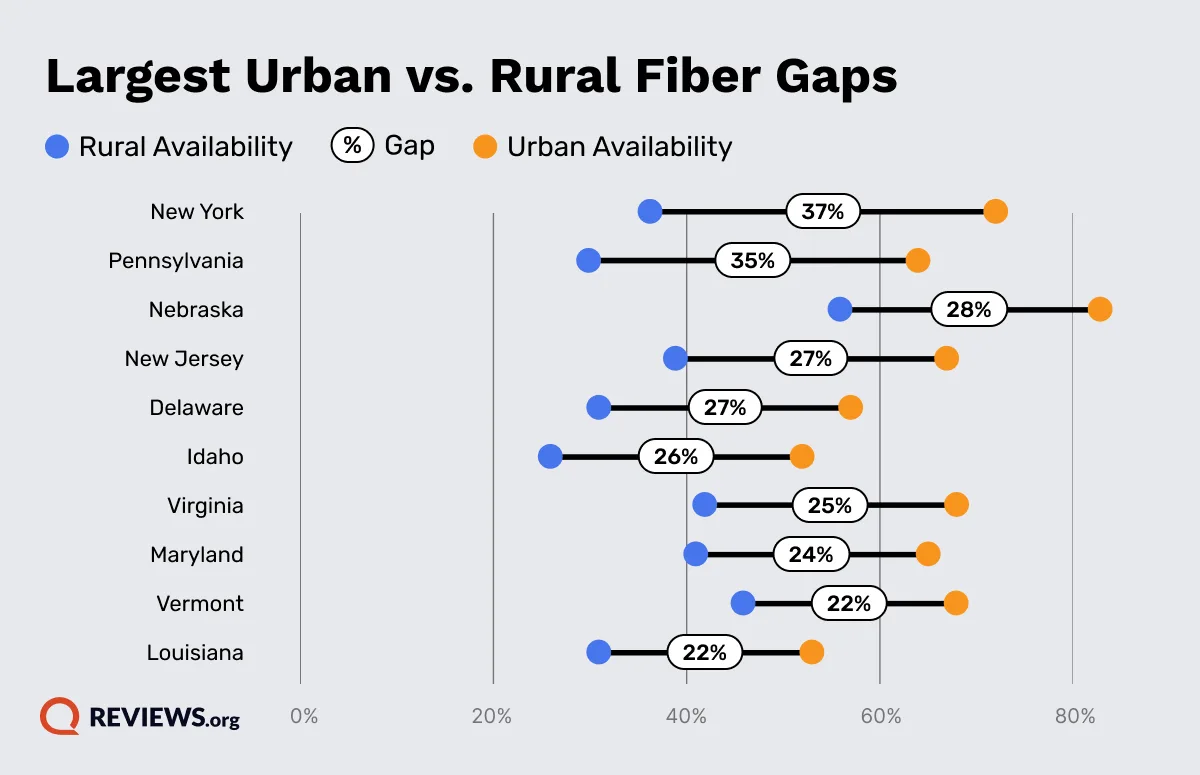
Even states with high overall fiber coverage still leave many residents without access. States like New York, Nebraska, New Jersey, Virginia, and Maryland have high overall fiber coverage (above 60%), their rural populations can't always enjoy the same high-speed internet.
New York and Pennsylvania have the largest urban-rural gaps in fiber coverage, both exceeding 34% — and all other states in the table below show gaps above 22%.
It's worth noting that Nebraska has more than half (56%) of its rural population covered — which still falls short of its 83% urban coverage, but represents meaningful access gains in rural communities.
In 2026, we can expect to see expansions in fiber coverage due to major provider acquisitions from AT&T and Verizon.
AT&T fiber expansion
AT&T purchased Lumen’s fiber business (which includes CenturyLink and Quantum Fiber), which expands coverage in 32 states. The deal provides AT&T with one million new customers and allows the company to extend fiber service to four million customer locations across 11 states. The telco giant plans to accelerate its fiber network construction to reach more than 60 million total fiber locations by the end of 2030.
Several key markets include:
- Denver
- Las Vegas
- Minneapolis-St. Paul
- Orlando
- Phoenix
- Portland
- Salt Lake City
In states such as Arizona, this could mean as high as 50% increased coverage. Arizona is one of the lowest ranked states for fiber internet coverage.
Verizon fiber expansion
Verizon acquired Frontier, adding to its existing Fios networks. The deal gives the company 2.2 million new fiber customers. Verizon’s fiber network now reaches 31 states and Washington D.C. across 25 million customer locations, with plans to add 2.8 million more by the end of 2026.
In addition to potential fiber coverage expansion and consumer options, the company hopes to retain and bring in more customers through some nice perks:
- Existing Verizon and Frontier customers can get discounts on mobile lines, new phones and trade-in deals.
- New or current customers can get bundled services with 6 months of fiber internet up to 1Gbps.
What do these acquisitions mean for customers?
Local internet branding will likely change for many customers—AT&T and Verizon will be far more visible as branding is switched over. Updates may roll out unevenly as availability is still determined by address, and expansion announcements vary by state and metro.
As always, it’s best to check your exact address for what options are available in your area.
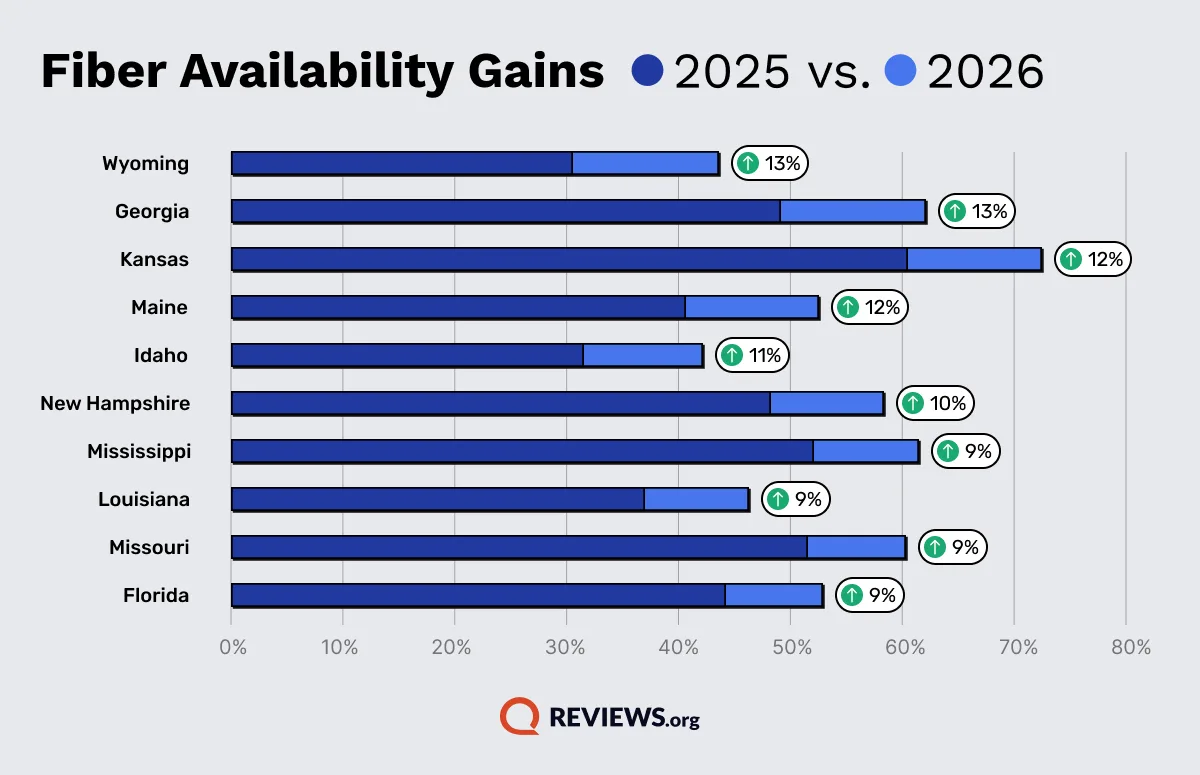
Year-over-year changes by state
The state with the greatest expansion in fiber availability is Wyoming (+13 percentage points), followed closely by Georgia (+13) and Kansas (+12). Six states improved by more than 10 percentage points, and the majority of states, 36 in total, improved by more than 5 percentage points.
Conversely, a few states saw minimal gains: Rhode Island (+1), New Jersey (+2) and New York (+3). That said, it's worth noting all three already have majority fiber penetration. New York and New Jersey are above 60%, and Rhode Island is above 80%.
Hawaii improved by only 3 percentage points, but it faces unique challenges for fiber expansion. Due to its high concentration of residents in Honolulu and its rural communities spread across other islands, it can be difficult and expensive to efficiently construct networks. It's a reminder that improving the digital divide isn’t a quick, easy, or cheap solution.
In general, fiber availability in the United States is growing across the board, and we’re seeing more people than ever connected to high-speed, reliable, and relatively cost-effective internet.
2025 to 2026 change in fiber availability by state
Methodology
We determined 2026 fiber availability by state using data from the FCC National Broadband Map (as of June 30, 2025). We filtered for residential locations with fiber internet access offering speeds of at least 100Mbps download and 20Mbps upload. We then aggregated this data by state and segmented it into urban and rural coverage using U.S. Census Bureau classifications.
Fiber availability across all 50 states and DC
Here’s a full view of US fiber internet availability at a state-by-state level.
Fiber availability in the US FAQ
Each state has varying availability of fiber internet, with Rhode Island, Nebraska, and Kansas
offering the highest fiber internet coverage. However, the best fiber internet providers are available across the country in various different states.
You can check if fiber internet is available in your area by typing your zip code in the search bar below, which will return a list of all the internet service providers in your area, including fiber providers, if they are available.

Find fiber internet in your area
Related Articles

The Cheapest Quantum Fiber Internet Plans: Save Money on Wi-Fi
Internet providers are known for jacking up prices every year, but Quantum Fiber’s cheapest plan...

Cheapest Internet and Wi-Fi Providers of 2026: Internet That Won’t Financially Destroy You
Fast internet is essential in the modern world, so you shouldn’t have to pay a...

Best Internet for Streaming in 2026: Watch to Your Heart’s Content
We have three fiber internet and two cable internet suggestions. We go over speeds, pricing,...

The Best Internet Providers of 2026: Lab Results and Expert Picks
Looking for the best home internet options? Read on to compare download speed, price, and...