The U.S. Internet Monopoly Map: States and Cities With the Least Internet Competition

It’s surprisingly common for a single internet provider to reign supreme in one area, but that doesn’t make it a good idea

Brianne Sandorf
Aug 04, 2025
Icon Time To Read5 min read
Icon CheckEdited ByRebecca Lee Armstrong
Icon CheckEdited ByTim Tincher

The ol’ US of A might be the internet’s birthplace, but that doesn’t mean we get our pick of internet providers. If anything, it’s the opposite. A surprising amount of states and metros experience a broadband monopoly, where only one wired internet provider operates without competition.

For instance, due to a broadband monopoly, Montana resident Shaun Michael Lewis was forced to purchase DSL services for his home and business from a local provider. “I attempted to identify a different provider on account of the low speeds and limited throughput of my residential connection but discovered there were none,” Lewis recalls. Having only one internet provider in the area meant no competition—and no alternatives.

That’s where we come in. We ranked all 50 U.S. states and over 300 metro areas by how fierce the internet competition is. Armed with this information, you get a better idea of whether you can switch providers or if you’d have to move first.

Why internet monopolies matter

With internet service so integral to day-to-day life, the lack of provider competition is both alarming and surprisingly widespread.

We found that over 8.7 million Americans live in metro areas with only one wired broadband provider, and fewer than 10% of 100+ metros offer two or more providers on most blocks. States with otherwise strong internet competition still have monopolies scattered throughout, and even populous areas are subject to them. For instance, nearly 60% of Springfield, Ohio, residents have only one internet provider option—and that’s in a city of around 700,000.

Contrary to what you might expect, monopolies aren’t great for internet service providers either, according to Reviews.org data. Consumer distrust and frustration run highest where internet choices are most limited, and 59% of Americans say they feel misled by ISP pricing. Resentment festers so strongly that many customers currently under a monopoly would switch providers if they could, potentially even at personal expense.

As an example, Shaun Michael Lewis jumped at the chance to switch his real estate brokerage to the newly-arrived Starlink, even though it’s expensive and his company is still under contract with the local monopoly. “We are deploying this alternative to the extent possible in an effort to break free of the rural monopolies in place in many of our markets,” explains Lewis.

What about wireless internet?

When gathering data about monopolies, we focused on broadband companies—those with wired internet connections. Some areas with broadband monopolies may have wireless alternatives like satellite or 5G providers, but these options may not be as fast or reliable as wired connections, even if they are available.

The 10 best and worst states for internet competition

Internet monopoly map (state version)

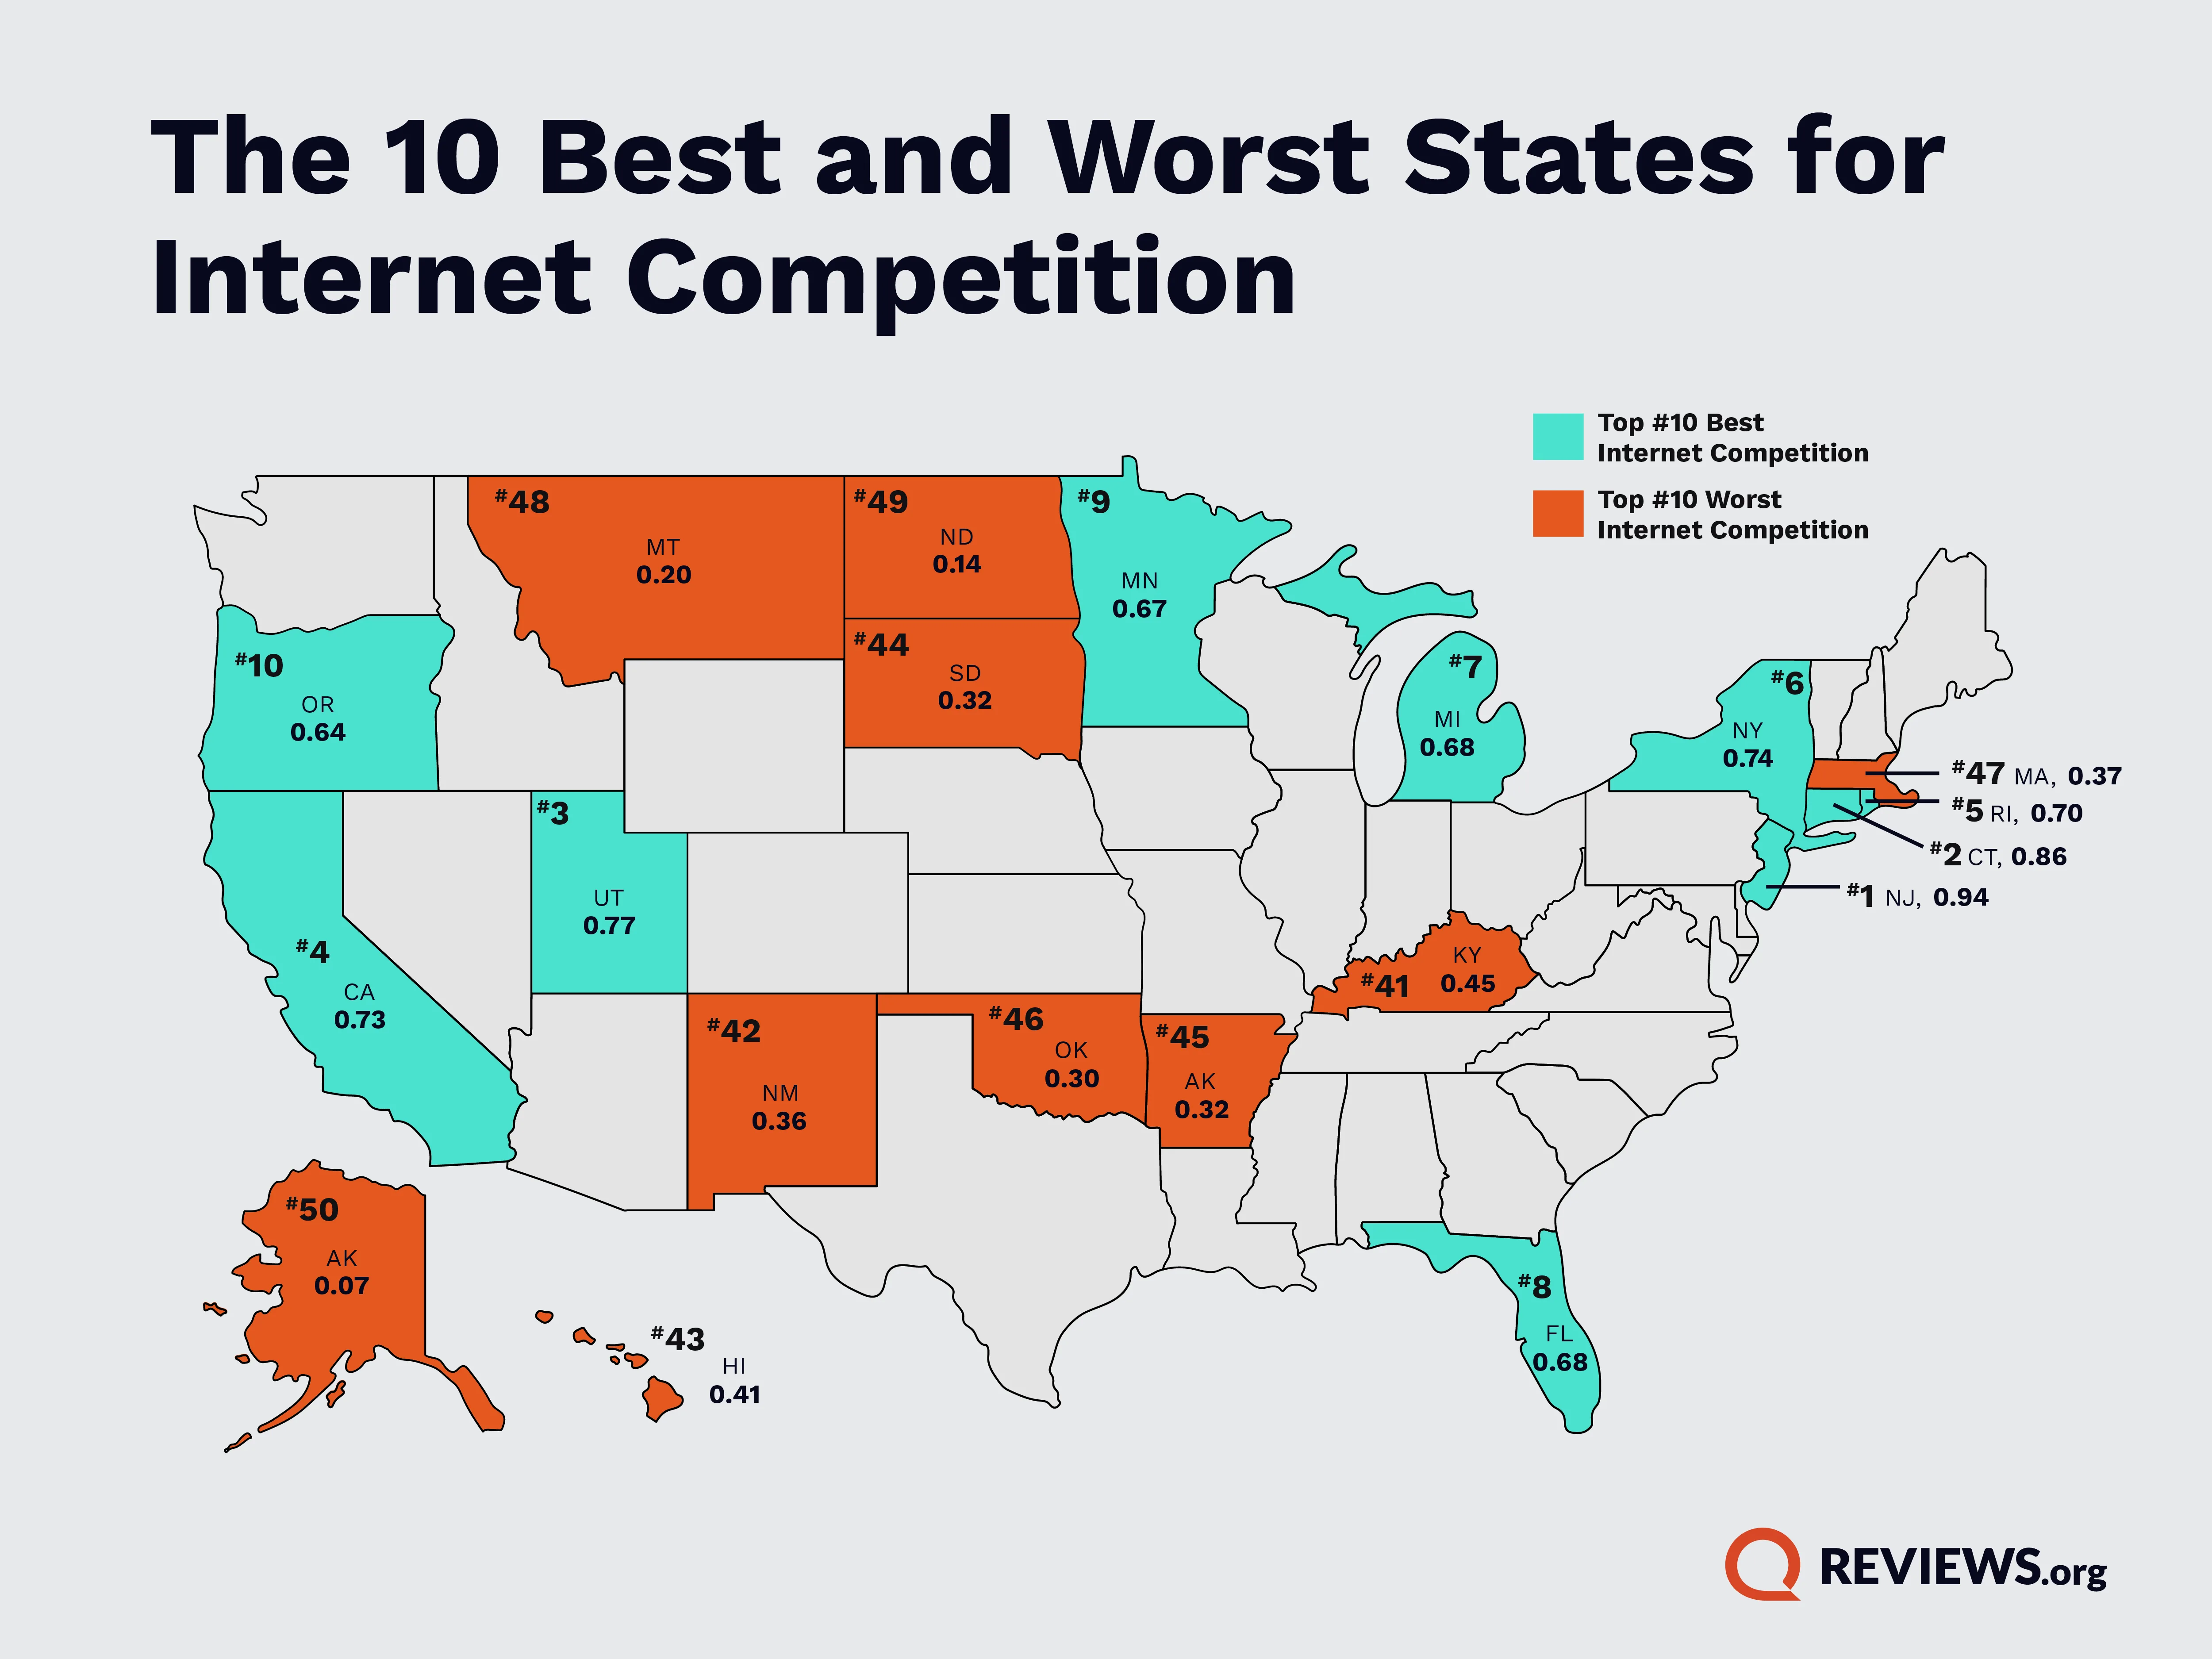
The internet monopoly map pictured above shows which states have the most and least internet competition. The best states for internet competition have more providers and fewer monopolies, while the worst states for internet competition have fewer providers and more monopolies.

To learn more about how the data we used to rank these states, check out our methodology.

The 10 best states for internet competition

Rank
State
% of census blocks with 2 or more providers
% of population with 2 or more providers
Combined internet competition score
1New Jersey4.25%96.19%0.94
2Connecticut3.12%99.73%0.86
3Utah2.66%97.78%0.77
4California2.49%96.76%0.73
5Rhode Island1.93%99.03%0.7
6New York2.88%94.64%0.74
7Michigan1.84%98.67%0.68
8Florida1.91%98.27%0.68
9Minnesota1.81%98.44%0.67
10Oregon1.58%98.42%0.64

Here’s what sticks out about the best states for internet competition:

  • High-performing states like New Jersey, Connecticut, and Utah all have strong ties to the technology sector, but they aren’t the first states you think of when it comes to technological innovation. Surprisingly, all three ranked above California, home to the tech giants of Silicon Valley.
  • Many leading states (such as Utah, New York, Connecticut, and Rhode Island) were early fiber internet adopters. That’s thanks to municipal-run networks, early rollouts of Verizon Fios across the East Coast, and state broadband initiatives— mainly in pockets of high population density.

The 10 worst states for internet competition

Rank
State
% of census blocks with 2 or more providers
% of population with 2 or more providers
Combined internet competition score
50Alaska0.83%72.17%0.07
49North Dakota0.24%79.82%0.14
48Montana0.61%80.39%0.2
47Massachusetts2.73%75.21%0.37
46Oklahoma1.09%83.06%0.3
45Arkansas1.00%84.64%0.32
44South Dakota0.57%87.51%0.32
43Hawaii2.51%79.42%0.41
42New Mexico0.59%89.87%0.36
41Kentucky1.55%88.12%0.45

Here’s what sticks out about the worst states for internet competition:

  • Many of these states are rural or have a low population density, like Alaska, Montana, and New Mexico. That’s unfortunate but unsurprising—areas with fewer people have fewer potential customers and may not seem worth it to some internet providers, even the bigger brands.
  • These states are also often heavily Broadband Equity Access and Deployment Program-eligible, meaning they’ve already been identified as areas where internet deployment is challenging.

The 10 best and worst metro areas for internet competition

Internet monopoly map (metro version)

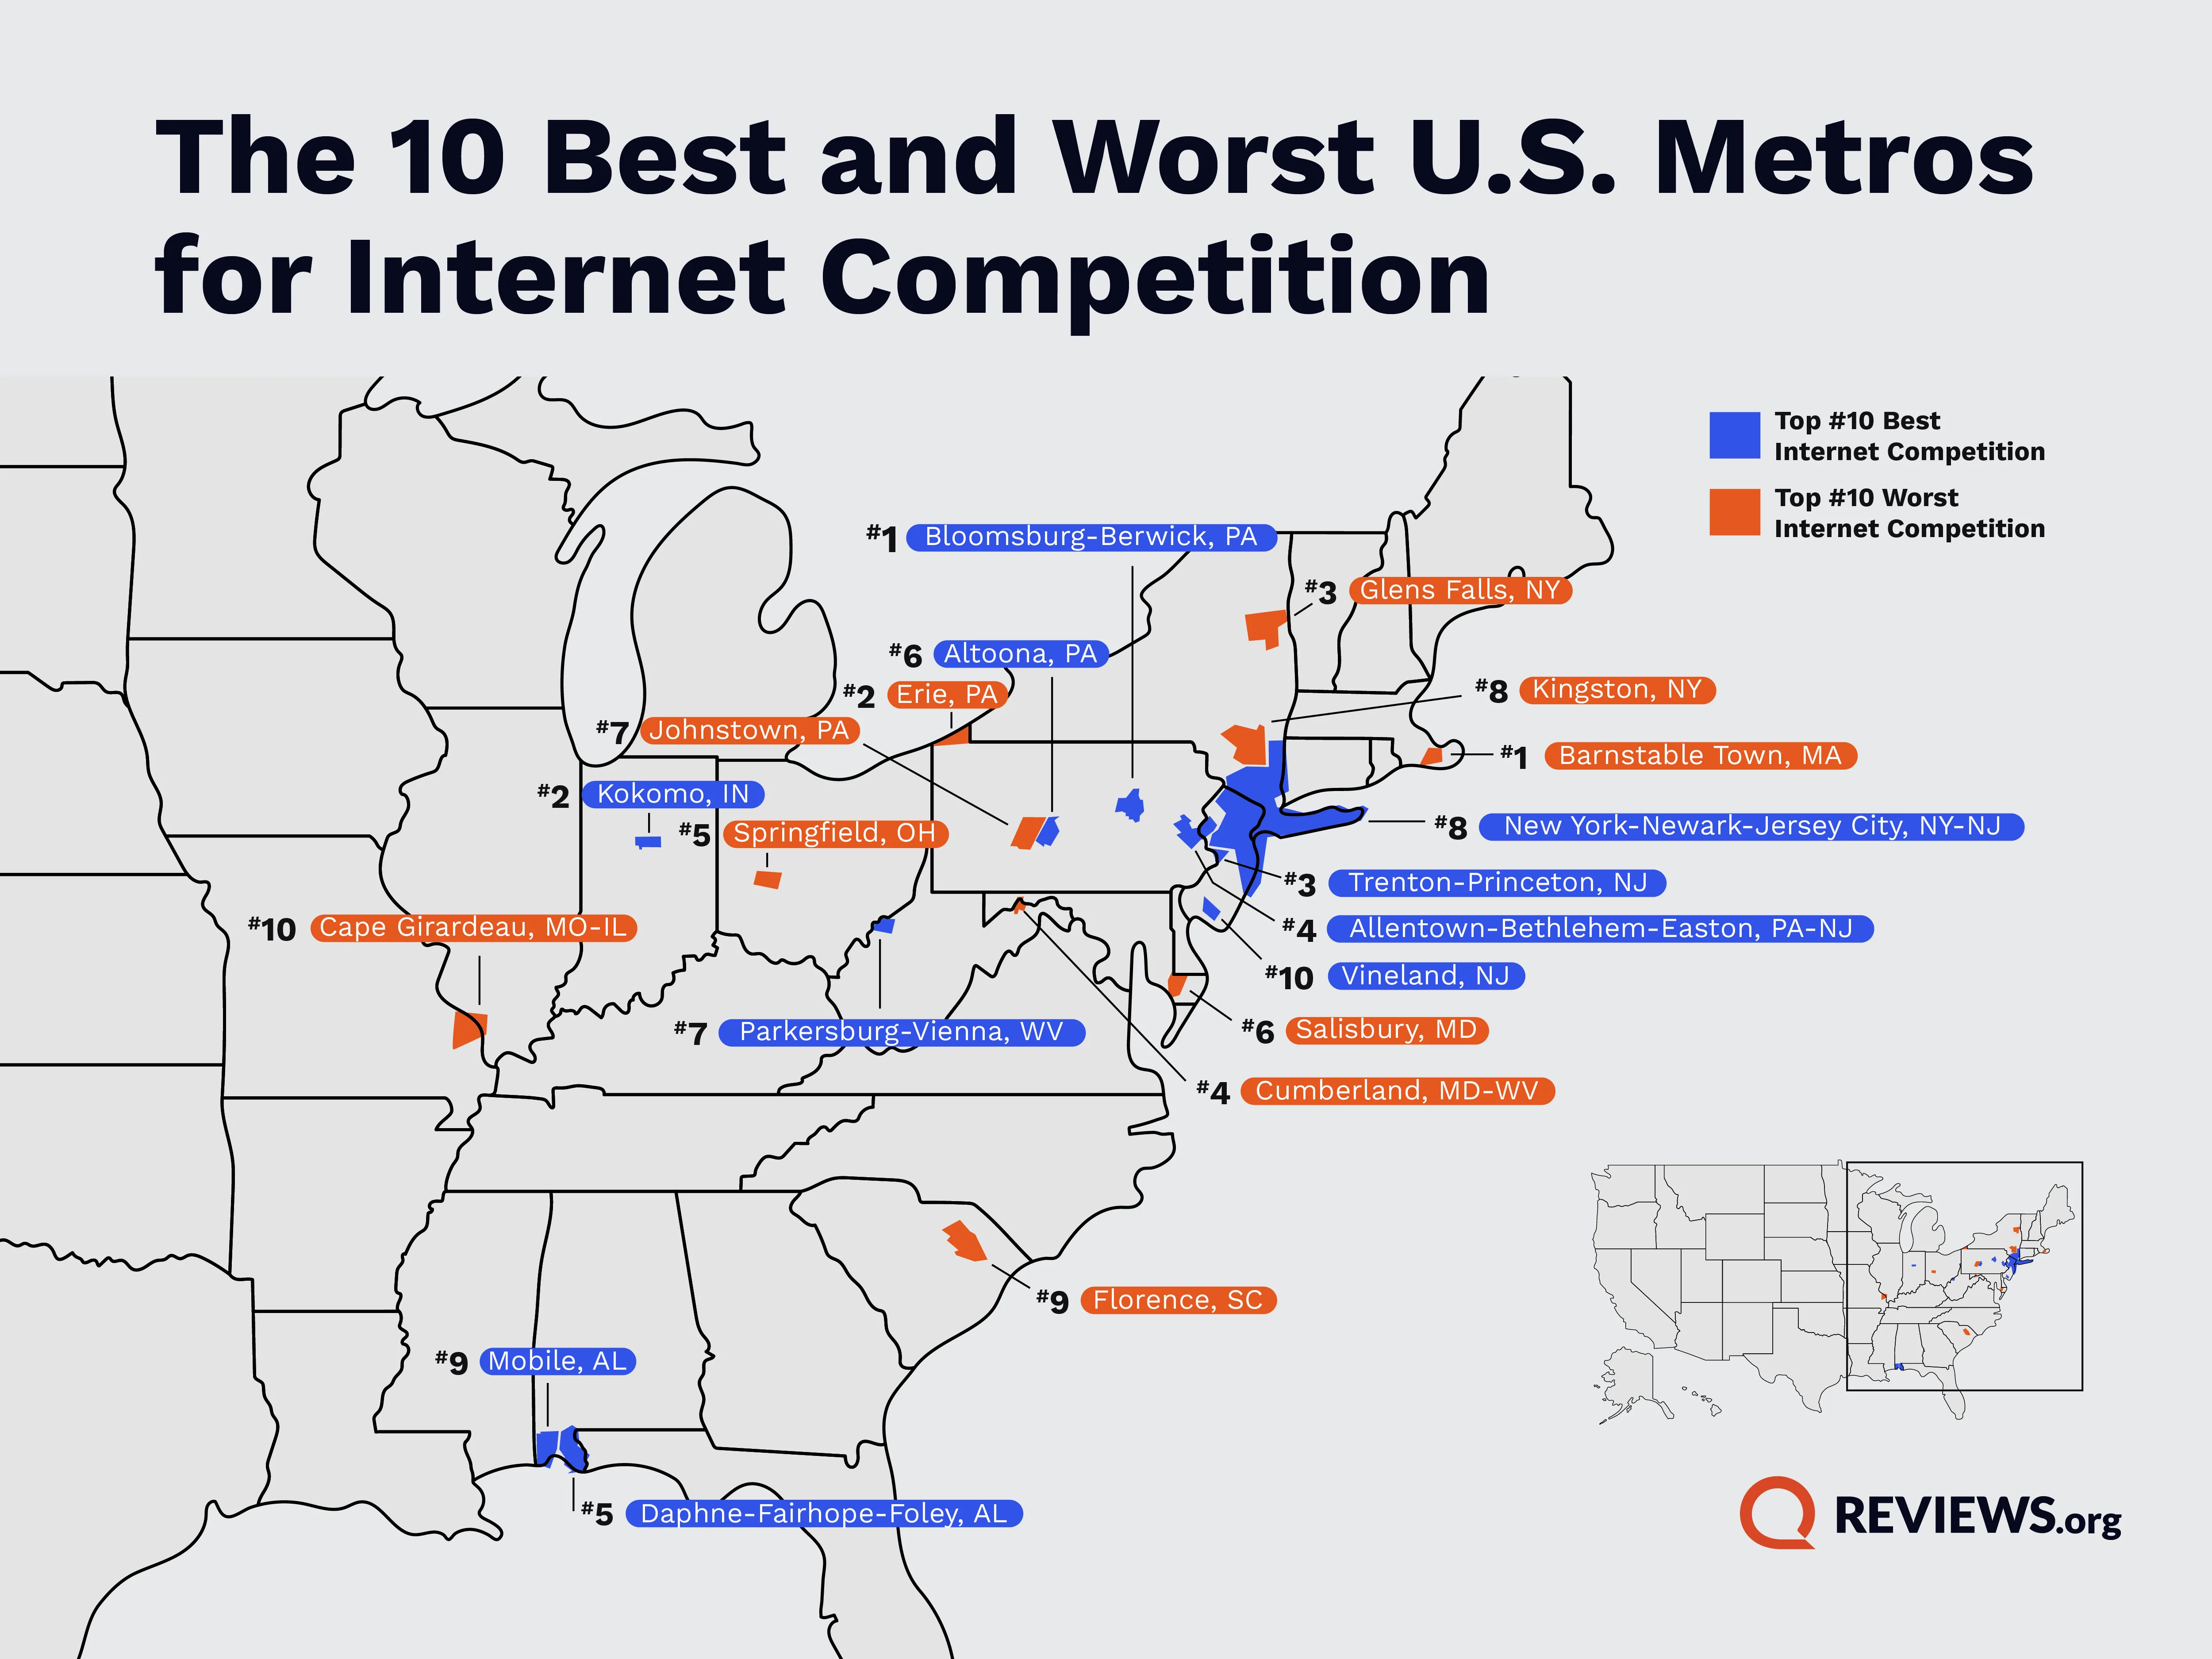
Like with our state internet monopoly map, the metro monopoly map above shows which metros have the most and least internet competition. Again, the best metros for internet competition have more providers and fewer monopolies, while the worst metros for internet competition have fewer providers and more monopolies.

The 10 best metros for internet competition

Rank
Metro area
% of census blocks with 2 or more providers (FCC)
% of metro population with 2 or more providers
Internet competition score
1Bloomsburg-Berwick, PA5.85%91.39%1.00
2Kokomo, IN5.50%93.98%0.98
3Trenton-Princeton, NJ5.04%98.91%0.96
4Allentown-Bethlehem-Easton, PA-NJ5.10%97.85%0.96
5Daphne-Fairhope-Foley, AL4.66%99.00%0.92
6Altoona, PA4.31%97.51%0.88
7Parkersburg-Vienna, WV4.17%98.55%0.87
8New York-Newark-Jersey City, NY-NJ4.07%99.18%0.86
9Mobile, AL4.31%93.30%0.85
10Vineland, NJ4.05%92.98%0.82

Here’s what sticks out to us about the best metros for internet competition:

The 10 worst metros for internet competition

Rank
Metro area
% of census blocks with 2 or more providers (FCC)
% of metro population with 2 or more providers
Internet competition score
1Barnstable Town, MA1.48%7.26%0.00
2Erie, PA1.18%16.32%0.03
3Glens Falls, NY1.21%18.97%0.05
4Cumberland, MD-WV0.51%45.48%0.14
5Springfield, OH0.83%40.71%0.14
6Salisbury, MD1.29%44.34%0.22
7Johnstown, PA2.08%31.73%0.22
8Kingston, NY1.87%36.51%0.23
9Florence, SC0.39%72.71%0.30
10Cape Girardeau, MO-IL2.27%49.73%0.35

Here’s what sticks out to us about the worst metros for internet competition:

  • In some of these metros—like Barnstable Town, Massachusetts, and Erie, Pennsylvania90% or more of residents live under an internet monopoly. 90% is far worse than their states’ averages. Providers may not be as interested in coming to these areas partly because of local groups that don’t buy year-round internet, like summer tourists and Amish communities.
  • Even states with decent competition overall, like New York, have pockets where a single internet service provider dominates.

Check for yourself

If you’re curious about the internet options where you live, you don’t have to wonder. You can try our address finder below to see what competition is like for your location.

reviews.org next zip logo
Find internet providers available in your area

How we got these numbers

How did we rank states and metro areas for internet competition? Let’s talk about the numbers we used and how we weighed them.

Our methodology for state rankings

We ranked U.S. states by broadband competition using an equally weighted score derived from two metrics: The percentage of census blocks with two or more wired broadband providers (FCC 2023 Broadband Data Collection) and the percentage of the population with similar access (Reviews.org 2024–2025 proprietary data). We incorporated population figures (2024 U.S. Census) to reflect impact.

We normalized both metrics on a 0 to 1 scale and averaged them for a final internet competition score, where higher scores indicate greater provider choice.     

Our methodology for metro rankings

To rank U.S. metro areas by broadband competition, we analyzed the top 303 metros using FCC data, proprietary provider data, and U.S. Census population estimates.

We based each metro’s internet competition score on two equally weighted metrics: The percentage of census blocks with access to two or more wired broadband providers (from the FCC’s 2023 Broadband Data Collection) and the percentage of the population with access to two or more providers (from Reviews.org’s 2024–2025 proprietary dataset, based on surveys, ISP reports, and local coverage data). We used population figures from the 2024 U.S. Census to reflect the number of people affected.

We normalized scores on a 0 to 1 scale, with higher scores indicating more competition.

Full ranking of US states for internet competition

Rank
State
% of census blocks with 2 or more providers
% of population with 2+
Internet competition score
1New Jersey4.25%96.19%0.94
2Connecticut3.12%99.73%0.86
3Utah2.66%97.78%0.77
4California2.49%96.76%0.73
5Rhode Island1.93%99.03%0.70
6New York2.88%94.64%0.74
7Michigan1.84%98.67%0.68
8Florida1.91%98.27%0.68
9Minnesota1.81%98.44%0.67
10Oregon1.58%98.42%0.64
11Washington1.38%98.86%0.63
12Georgia1.88%96.46%0.65
13Indiana2.02%95.69%0.65
14Ohio2.01%95.69%0.65
15Texas1.91%95.99%0.64
16Maine1.98%95.40%0.64
17North Carolina1.60%96.93%0.62
18New Hampshire2.29%93.51%0.64
19Nevada1.67%95.89%0.61
20Illinois1.92%94.64%0.62
21Colorado1.26%97.31%0.58
22Wisconsin1.25%96.78%0.57
23Wyoming1.63%94.53%0.58
24West Virginia2.15%91.73%0.59
25Vermont2.04%92.23%0.59
26Tennessee1.61%93.99%0.57
27Pennsylvania2.99%87.65%0.62
28South Carolina1.67%93.59%0.57
29Maryland2.27%90.34%0.58
30Virginia2.14%90.64%0.57
31Iowa1.34%94.22%0.54
32Arizona1.28%94.33%0.53
33Nebraska1.13%93.74%0.50
34Missouri1.90%90.20%0.53
35Louisiana1.26%92.16%0.49
36Kansas1.24%91.96%0.48
37Alabama1.45%90.23%0.48
38Idaho0.98%92.23%0.46
39Delaware2.71%83.75%0.52
40Mississippi1.36%89.67%0.46
41Kentucky1.55%88.12%0.45
42New Mexico0.59%89.87%0.36
43Hawaii2.51%79.42%0.41
44South Dakota0.57%87.51%0.32
45Arkansas1.00%84.64%0.32
46Oklahoma1.09%83.06%0.30
47Massachusetts2.73%75.21%0.37
48Montana0.61%80.39%0.20
49North Dakota0.24%79.82%0.14
50Alaska0.83%72.17%0.07

Full ranking of US metros for internet competition

Rank
Metro area
% of census blocks with 2 or more providers
% of population with 2+
Combined internet competition score
1Bloomsburg-Berwick–PA5.85%91.39%1
2Kokomo–IN5.50%93.98%0.979512822
3Trenton-Princeton–NJ5.04%98.91%0.962337595
4Allentown-Bethlehem-Easton–PA-NJ5.10%97.85%0.961913588
5Daphne-Fairhope-Foley–AL4.66%99.00%0.922701437
6Altoona–PA4.31%97.51%0.876144024
7Parkersburg-Vienna–WV4.17%98.55%0.867974712
8New York-Newark-Jersey City–NY-NJ4.07%99.18%0.861418359
9Mobile–AL4.31%93.30%0.849243121
10Vineland–NJ4.05%92.98%0.819685446
11Santa Cruz-Watsonville–CA3.61%99.78%0.816575457
12Evansville–IN3.77%97.10%0.816381938
13Monroe–MI3.81%96.15%0.814544425
14Dothan–AL3.61%99.20%0.812869394
15Elizabethtown–KY3.39%100.00%0.794701015
16Elkhart-Goshen–IN3.50%98.14%0.79445615
17Battle Creek–MI3.45%98.72%0.792871261
18Hattiesburg–MS3.70%94.23%0.790635985
19Odessa–TX3.33%98.07%0.776019629
20Ogden-Clearfield–UT3.20%99.87%0.773764728
21Davenport-Moline-Rock Island–IA-IL3.21%99.19%0.770477879
22Kansas City–MO-KS3.15%99.04%0.763170272
23Fort Wayne–IN3.08%99.66%0.759724592
24Panama City-Panama City Beach–FL3.26%96.46%0.758324778
25Peoria–IL3.08%99.41%0.758127151
26Philadelphia-Camden-Wilmington–PA-NJ-DE-MD3.18%97.26%0.754971065
27Athens-Clarke County–GA3.43%92.85%0.75324697
28Pittsfield–MA3.26%95.22%0.750401471
29Lancaster–PA3.20%95.79%0.747694494
30Bellingham–WA2.96%99.31%0.74478989
31Pocatello–ID2.90%99.91%0.742274605
32Jefferson City–MO3.84%83.57%0.737335775
33Myrtle Beach-Conway-North Myrtle Beach–SC2.81%100.00%0.73332597
34Beckley–WV3.43%89.69%0.733055318
35San Francisco-Oakland-Fremont–CA2.89%98.53%0.732398541
36Atlantic City-Hammonton–NJ4.02%79.37%0.729546197
37Clarksville–TN-KY2.85%98.50%0.727974087
38Wildwood-The Villages–FL2.78%99.57%0.7274038
39Hilton Head Island-Bluffton-Port Royal–SC2.82%98.82%0.72684424
40Texarkana–TX-AR3.24%91.84%0.726687691
41Salt Lake City-Murray–UT2.73%99.93%0.724413163
42Los Angeles-Long Beach-Anaheim–CA2.76%99.41%0.724265057
43Corpus Christi–TX2.94%95.17%0.716219889
44Dalton–GA2.66%99.72%0.71566398
45San Jose-Sunnyvale-Santa Clara–CA2.67%99.50%0.715316422
46Harrisonburg–VA4.65%66.37%0.713145272
47Rockford–IL2.62%99.91%0.712645273
48Provo-Orem-Lehi–UT2.62%99.80%0.711942399
49Hanford-Corcoran–CA3.47%85.65%0.711473436
50Riverside-San Bernardino-Ontario–CA2.68%98.56%0.710368235
51Wausau–WI2.85%95.59%0.709379876
52Durham-Chapel Hill–NC2.63%98.83%0.706802519
53Sherman-Denison–TX3.08%91.35%0.70662566
54Hagerstown-Martinsburg–MD-WV2.88%94.29%0.704247755
55Boston-Cambridge-Newton–MA-NH3.12%89.66%0.700059722
56Raleigh-Cary–NC2.50%99.89%0.699819193
57Modesto–CA2.52%99.51%0.699507463
58Santa Maria-Santa Barbara–CA2.58%98.35%0.698444481
59Greenville–NC2.75%95.42%0.697711712
60San Antonio-New Braunfels–TX2.64%97.02%0.696295238
61Dallas-Fort Worth-Arlington–TX2.45%99.73%0.693505878
62Naples-Marco Island–FL2.44%99.81%0.692958869
63Portland-South Portland–ME2.50%98.66%0.691959784
64Corvallis–OR2.38%100.00%0.687823781
65Austin-Round Rock-San Marcos–TX2.39%99.55%0.686006578
66Syracuse–NY2.58%96.22%0.684834285
67Olympia-Lacey-Tumwater–WA2.29%99.84%0.677277705
68Atlanta-Sandy Springs-Roswell–GA2.31%99.21%0.675368535
69Rochester–NY2.77%91.56%0.675163607
70Indianapolis-Carmel-Greenwood–IN2.27%99.29%0.671646955
71Lafayette–LA2.29%98.16%0.666542903
72Kiryas Joel-Poughkeepsie-Newburgh–NY2.36%96.55%0.663662717
73Memphis–TN-MS-AR2.34%96.87%0.663591061
74Visalia–CA2.81%89.03%0.663230267
75Manchester-Nashua–NH2.23%98.36%0.661471713
76Lansing-East Lansing–MI2.20%98.55%0.659511197
77Madison–WI2.17%98.94%0.658828633
78Scranton--Wilkes-Barre–PA3.58%75.36%0.657362867
79Akron–OH2.26%97.16%0.656978569
80Charleston–WV2.20%98.05%0.656316315
81Miami-Fort Lauderdale-West Palm Beach–FL2.10%99.57%0.655446851
82Oxnard-Thousand Oaks-Ventura–CA2.36%95.19%0.654972639
83Columbus–OH2.16%98.26%0.653425404
84North Port-Bradenton-Sarasota–FL2.10%99.10%0.652443662
85Harrisburg-Carlisle–PA2.10%99.01%0.651868584
86Knoxville–TN2.20%97.23%0.651076709
87Longview–TX2.19%97.39%0.651040881
88Portland-Vancouver-Hillsboro–OR-WA2.05%99.68%0.650858773
89Detroit-Warren-Dearborn–MI2.03%99.82%0.649636959
90Houston-Pasadena-The Woodlands–TX2.03%99.73%0.64906188
91Dayton-Kettering-Beavercreek–OH2.13%97.95%0.648270006
92Champaign-Urbana–IL2.03%99.41%0.647017156
93Joplin–MO-KS2.40%93.17%0.646298079
94Huntsville–AL2.03%99.22%0.645803101
95Ithaca–NY2.11%97.84%0.645450751
96Pittsburgh–PA2.23%95.79%0.645050022
97Toledo–OH1.97%99.83%0.643351714
98Savannah–GA2.07%98.16%0.643262714
99Kahului-Wailuku–HI2.70%87.65%0.642772299
100Merced–CA2.12%97.18%0.642291698
101Auburn-Opelika–AL2.09%97.53%0.641353544
102Laredo–TX1.96%99.62%0.640951673
103Fayetteville–NC2.00%98.47%0.637836207
104Louisville/Jefferson County–KY-IN2.01%98.20%0.637169162
105Vallejo–CA1.90%100.00%0.637030641
106San Luis Obispo-Paso Robles–CA1.99%98.42%0.636458529
107San Diego-Chula Vista-Carlsbad–CA1.93%99.00%0.633815449
108Charlotte-Concord-Gastonia–NC-SC1.94%98.77%0.633403994
109Dubuque–IA2.04%96.81%0.631461962
110Gettysburg–PA1.83%100.00%0.629623308
111Lakeland-Winter Haven–FL1.82%99.86%0.62767055
112Appleton–WI1.81%99.91%0.626931848
113Ames–IA1.99%96.73%0.625659829
114Sacramento-Roseville-Folsom–CA1.93%97.72%0.625636552
115Spokane-Spokane Valley–WA1.99%96.48%0.624062388
116Cincinnati–OH-KY-IN2.59%86.23%0.622058741
117Tucson–AZ1.94%96.94%0.621710727
118Cape Coral-Fort Myers–FL1.75%100.00%0.621157784
118Grants Pass–OR1.75%100.00%0.621157784
120Buffalo-Cheektowaga–NY2.87%81.42%0.620953312
121Walla Walla–WA1.75%99.73%0.619432548
122Las Vegas-Henderson-North Las Vegas–NV1.77%99.36%0.619184716
123Rapid City–SD1.88%97.52%0.619067647
124Kalamazoo-Portage–MI1.69%99.93%0.614361358
125Columbia–SC1.89%96.61%0.614311153
126Pine Bluff–AR2.70%83.19%0.614273955
127Midland–TX1.88%96.62%0.61331686
128Port St. Lucie–FL1.67%100.00%0.612692261
129Colorado Springs–CO1.82%97.38%0.611823937
130Salinas–CA2.07%93.16%0.611313897
131Gainesville–GA2.82%80.72%0.611189525
132Twin Falls–ID1.90%95.74%0.609810249
133Morristown–TN2.04%93.34%0.609289483
134Anniston-Oxford–AL1.75%97.95%0.608058769
135Chicago-Naperville-Elgin–IL-IN1.87%95.91%0.607721938
136Spartanburg–SC1.84%96.32%0.607167169
137St. Louis–MO-IL1.70%98.51%0.606346085
138Gulfport-Biloxi–MS1.63%99.27%0.603794972
139Denver-Aurora-Centennial–CO1.63%99.26%0.603731074
140Bangor–ME1.66%98.37%0.601218756
141Lexington-Fayette–KY1.71%97.52%0.60107841
142Baltimore-Columbia-Towson–MD1.85%95.19%0.601004927
143Grand Rapids-Wyoming-Kentwood–MI1.55%99.98%0.59986618
144Williamsport–PA1.92%93.68%0.598763718
145Greensboro-High Point–NC1.67%97.74%0.598251396
146Fresno–CA2.00%92.23%0.597964085
147Orlando-Kissimmee-Sanford–FL1.56%99.47%0.597665591
148Roanoke–VA2.33%86.70%0.597548978
149Billings–MT1.82%94.96%0.59636071
150Brownsville-Harlingen–TX1.71%96.71%0.595902701
151Cedar Rapids–IA1.63%97.89%0.594977098
152Nashville-Davidson--Murfreesboro--Franklin–TN1.66%97.38%0.594892891
153Chambersburg–PA1.69%96.86%0.594744785
154Virginia Beach-Chesapeake-Norfolk–VA-NC1.91%92.98%0.593232693
155El Centro–CA2.22%87.79%0.592873725
156Morgantown–WV1.57%98.54%0.592781302
157Terre Haute–IN1.88%93.38%0.592614027
158Mankato–MN1.71%96.07%0.591813253
159Killeen-Temple–TX1.63%97.36%0.591590524
160Lawrence–KS1.45%100.00%0.589412071
161Seattle-Tacoma-Bellevue–WA1.46%99.79%0.589128411
162Janesville-Beloit–WI1.46%99.67%0.58836164
163Reno–NV1.49%99.16%0.588277432
164Phoenix-Mesa-Chandler–AZ1.45%99.35%0.585258725
165Kennewick-Richland–WA1.38%99.95%0.58168525
166Waco–TX2.03%89.07%0.580947004
167El Paso–TX1.62%95.81%0.5806282
168Wenatchee-East Wenatchee–WA1.38%99.75%0.580407297
169Augusta-Richmond County–GA-SC1.74%93.73%0.580035778
170Urban Honolulu–HI2.65%78.45%0.578695525
171Casper–WY1.40%99.06%0.578114741
172Montgomery–AL1.70%94.05%0.577847741
173Sebastian-Vero Beach-West Vero Corridor–FL1.60%95.70%0.577808946
174Baton Rouge–LA1.52%96.91%0.577075036
175Winchester–VA-WV2.14%86.32%0.57501525
176Waterloo-Cedar Falls–IA1.33%99.64%0.574413471
177Richmond–VA1.76%92.31%0.573078695
178Charlottesville–VA1.89%90.09%0.572649896
179Napa–CA2.27%83.71%0.572094443
180Cheyenne–WY1.38%98.17%0.570311471
181Duluth–MN-WI1.71%92.49%0.5689379
182Ocala–FL1.26%99.83%0.568220193
183Lynchburg–VA2.80%74.14%0.567028502
184Houma-Bayou Cane-Thibodaux–LA2.11%85.53%0.566792766
185Johnson City–TN1.39%97.43%0.566641237
186Kingsport-Bristol–TN-VA1.40%97.26%0.566613168
187Boulder–CO1.32%98.43%0.565623667
188Bloomington–IN1.25%99.58%0.565564562
189Hickory-Lenoir-Morganton–NC1.32%98.41%0.565495872
190Wilmington–NC1.30%98.68%0.565104727
191Chattanooga–TN-GA1.30%98.55%0.564274058
192Valdosta–GA1.44%96.04%0.563050418
193Amarillo–TX1.29%98.28%0.561490631
194Niles–MI1.20%99.68%0.560912586
195Kankakee–IL2.60%76.48%0.56081674
196Tallahassee–FL1.19%99.80%0.560621167
197Little Rock-North Little Rock-Conway–AR1.44%95.64%0.560494513
198Chico–CA2.78%73.31%0.559608618
199Lake Havasu City-Kingman–AZ1.49%94.66%0.559523497
200Reading–PA2.88%71.54%0.558880641
201Salem–OR1.27%98.14%0.558479684
202Grand Island–NE1.37%96.45%0.558262888
203Fort Collins-Loveland–CO1.22%98.79%0.557342078
204Sumter–SC1.36%96.45%0.557204698
205Bremerton-Silverdale-Port Orchard–WA1.14%100.00%0.556608168
206Omaha–NE-IA1.26%97.76%0.554993383
207Enid–OK1.82%88.40%0.554443864
208Punta Gorda–FL1.08%100.00%0.550259025
209Logan–UT-ID1.28%96.51%0.54912256
210Bend–OR1.33%95.64%0.548854418
211Lebanon–PA2.35%78.74%0.548802844
212Wheeling–WV-OH1.77%88.02%0.546724801
213Asheville–NC1.29%95.88%0.5461552
214Bakersfield-Delano–CA1.55%91.48%0.545553193
215Lawton–OK1.75%87.78%0.543074877
216Danville–KY2.17%80.71%0.542343249
217Coeur d'Alene–ID1.49%91.79%0.541184877
218Oklahoma City–OK1.32%94.60%0.541150874
219Racine-Mount Pleasant–WI1.25%95.29%0.538152478
220Saginaw–MI0.96%100.00%0.53756074
221Iowa City–IA1.73%87.08%0.536485662
222Santa Fe–NM1.09%97.38%0.534576036
223Muskegon-Norton Shores–MI0.93%100.00%0.534386169
224Tyler–TX1.96%82.94%0.534370422
225Owensboro–KY1.80%85.54%0.53405276
226Fond du Lac–WI1.01%98.53%0.53345874
227New Bern–NC1.02%98.22%0.532536104
228Ann Arbor–MI0.90%100.00%0.531211597
229New Orleans-Metairie–LA1.01%98.01%0.530136063
230Jackson–TN0.93%99.29%0.529849437
231Providence-Warwick–RI-MA1.85%83.87%0.528672807
232Oshkosh-Neenah–WI0.90%99.27%0.52654707
233Lake Charles–LA0.92%98.92%0.526427034
234Santa Rosa-Petaluma–CA1.17%94.47%0.524447348
235Manhattan–KS1.14%94.43%0.521017186
236Dover–DE2.36%74.12%0.520340328
237Sioux Falls–SD-MN0.97%97.05%0.519769129
238Lima–OH0.79%100.00%0.519571503
239Tulsa–OK0.97%96.97%0.519257948
240Green Bay–WI1.00%96.42%0.518918149
241Eugene-Springfield–OR0.82%99.16%0.517378673
242Cleveland–TN0.77%99.95%0.517135634
243Goldsboro–NC0.81%99.19%0.516512175
244La Crosse-Onalaska–WI-MN0.75%100.00%0.515338741
245Shreveport-Bossier City–LA1.01%95.52%0.514225553
246Binghamton–NY1.58%85.96%0.513456271
247Lincoln–NE0.83%98.09%0.511599816
248Hammond–LA0.94%95.80%0.508607353
249Fort Smith–AR-OK1.54%85.79%0.508137249
250Sheboygan–WI0.68%99.94%0.507548022
251Boise City–ID0.81%97.77%0.507438711
252Pensacola-Ferry Pass-Brent–FL0.79%97.93%0.506344693
253Lubbock–TX0.84%97.08%0.506204346
254Canton-Massillon–OH0.72%99.05%0.506093894
255Medford–OR0.66%100.00%0.505815027
256Milwaukee-Waukesha–WI0.67%99.74%0.505211879
257Flint–MI0.64%100.00%0.503698646
258Des Moines-West Des Moines–IA0.89%95.67%0.502485732
259Pueblo–CO0.65%99.43%0.501114671
260Grand Junction–CO0.84%95.93%0.498856118
261Fargo–ND-MN0.66%98.38%0.49546361
262Wichita–KS0.62%98.92%0.494681321
263Las Cruces–NM0.71%97.21%0.49327854
264Eau Claire–WI0.54%100.00%0.493116742
265Deltona-Daytona Beach-Ormond Beach–FL0.67%97.56%0.491282195
266Bowling Green–KY0.74%96.27%0.490446734
267Sioux City–IA-NE-SD0.98%91.96%0.488303424
268Crestview-Fort Walton Beach-Destin–FL0.47%100.00%0.485709409
269Birmingham–AL0.84%93.84%0.485501513
270College Station-Bryan–TX0.43%99.96%0.481221056
271Rocky Mount–NC0.78%93.22%0.475190717
272Idaho Falls–ID1.41%82.35%0.472399988
273Decatur–IL0.81%92.06%0.470953163
274Redding–CA2.11%70.05%0.467879231
275Blacksburg-Christiansburg-Radford–VA1.40%81.62%0.466677271
276Elmira–NY1.99%71.55%0.46476559
277Worcester–MA2.26%67.07%0.464710593
278Albuquerque–NM0.38%97.77%0.461936523
279Palm Bay-Melbourne-Titusville–FL0.25%99.77%0.460959574
280Yuba City–CA0.71%91.87%0.459157204
281Huntington-Ashland–WV-KY-OH0.80%90.07%0.457179344
282Youngstown-Warren–OH1.00%86.57%0.455978981
283Topeka–KS0.80%89.67%0.454623439
284Beaumont-Port Arthur–TX0.67%91.10%0.450004325
285San Angelo–TX0.44%94.52%0.447518935
286Tuscaloosa–AL1.06%83.71%0.444053401
287Watertown-Fort Drum–NY1.53%75.32%0.440178238
288Abilene–TX0.45%91.65%0.430238505
289Lexington Park–MD0.71%86.06%0.42203268
290Anchorage–AK0.59%86.86%0.414446205
291Rome–GA1.16%76.29%0.407223262
292Missoula–MT0.90%77.96%0.390381216
293York-Hanover–PA2.03%56.92%0.375516116
294Cape Girardeau–MO-IL2.27%49.73%0.354970289
295Florence–SC0.39%72.71%0.302867247
296Kingston–NY1.87%36.51%0.228170002
297Johnstown–PA2.08%31.73%0.219848932
298Salisbury–MD1.29%44.34%0.216826803
299Springfield–OH0.83%40.71%0.144955202
300Cumberland–MD-WV0.51%45.48%0.141572279
301Glens Falls–NY1.21%18.97%0.046252986
302Erie–PA1.18%16.32%0.026145542
303Barnstable Town–MA1.48%7.26%0
Brianne Sandorf
Written by
After five years with Reviews.org, Brianne can and will tell you which internet or mobile provider you should sign up for. She’s talked with internet customers across the U.S. and beyond and addresses their real-life concerns in every piece she writes. Brianne also created the ratings system for the Reviews.org internet service provider reviews and wrote most of them. Brianne channels her lifelong interest in detective work by hunting for obscure, need-to-know information about internet service providers. She’s always learning so that she can pass her knowledge on to Reviews.org readers. Her writing and expertise have appeared in numerous other publications, including Move.org, Parents.com, and the Stanford student blog. Her work for Reviews.org is also cited in a research paper about smart home assistants titled “Expert-Generated Privacy Q&A Dataset for Conversational AI and User Study Insights.” Brianne is a homegrown Utahn who loves to travel and see new places. She graduated from Westminster College with a double major in honors and creative writing. After 20 years in a 8,000-person city, she now lives in Murray, a bustling metropolis of 50,000 where she and her husband raise their two little girls.

Related Articles

A young couple sitting on the couch in living room watching TV
Sling TV vs. fuboTV
Sling TV and fuboTV are both great cable alternatives. Sling has super low prices for...
NFL Logo on grass
NFL RedZone Channel Review
With the NFL RedZone Channel, you'll only see the exciting moments. During the Sunday games,...
Older couple sitting on couch eating popcorn watching live TV streaming service
Live TV Streaming Service Channel Comparison Review
If you need to find the best live TV streaming service with all of your...
Friends watching football on a streaming service
Best Streaming Service for Sports
Find the best sports streaming service for you, whether you’re a fan of professional football,...