U.S. households with home internet by connection type
Just under 94% of households in the U.S. have an internet connection, and 88.67% of those connections are broadband connections (DSL, cable or fiber internet) and 6.7% of those connections are satellite.
And while a very small percentage has dial-up, a total of 4.5% of households have no internet subscription at all, which means a lack of internet access for online work, school, health care, entertainment, shopping, and more.
U.S. households with home internet by connection type (2024 ACS data)
Connection type | No. of households | % of households |
| Total US households (including Puerto Rico & DC) | 132,407,459 | – |
|---|
| Households with an internet connection | 123,568,575 | 93.32% |
|---|
| Dial-up | 127,479 | 0.1%
|
|---|
| With DSL, cable or fiber internet | 117,400,661 | 88.67%
|
|---|
| With satellite internet | 8,875,306 | 6.7%
|
|---|
| No internet subscription | 6,011,004 | 4.5% |
|---|
When did dial-up internet go away? Though dial-up never officially "ended" and still continues, the number of users is dwindling to less than a tenth of a percent of U.S. households. With the discontinuation of AOL's dial-up service, it's likely by the time the next ACS survey comes around, dial-up access numbers will show virtually no remaining users.
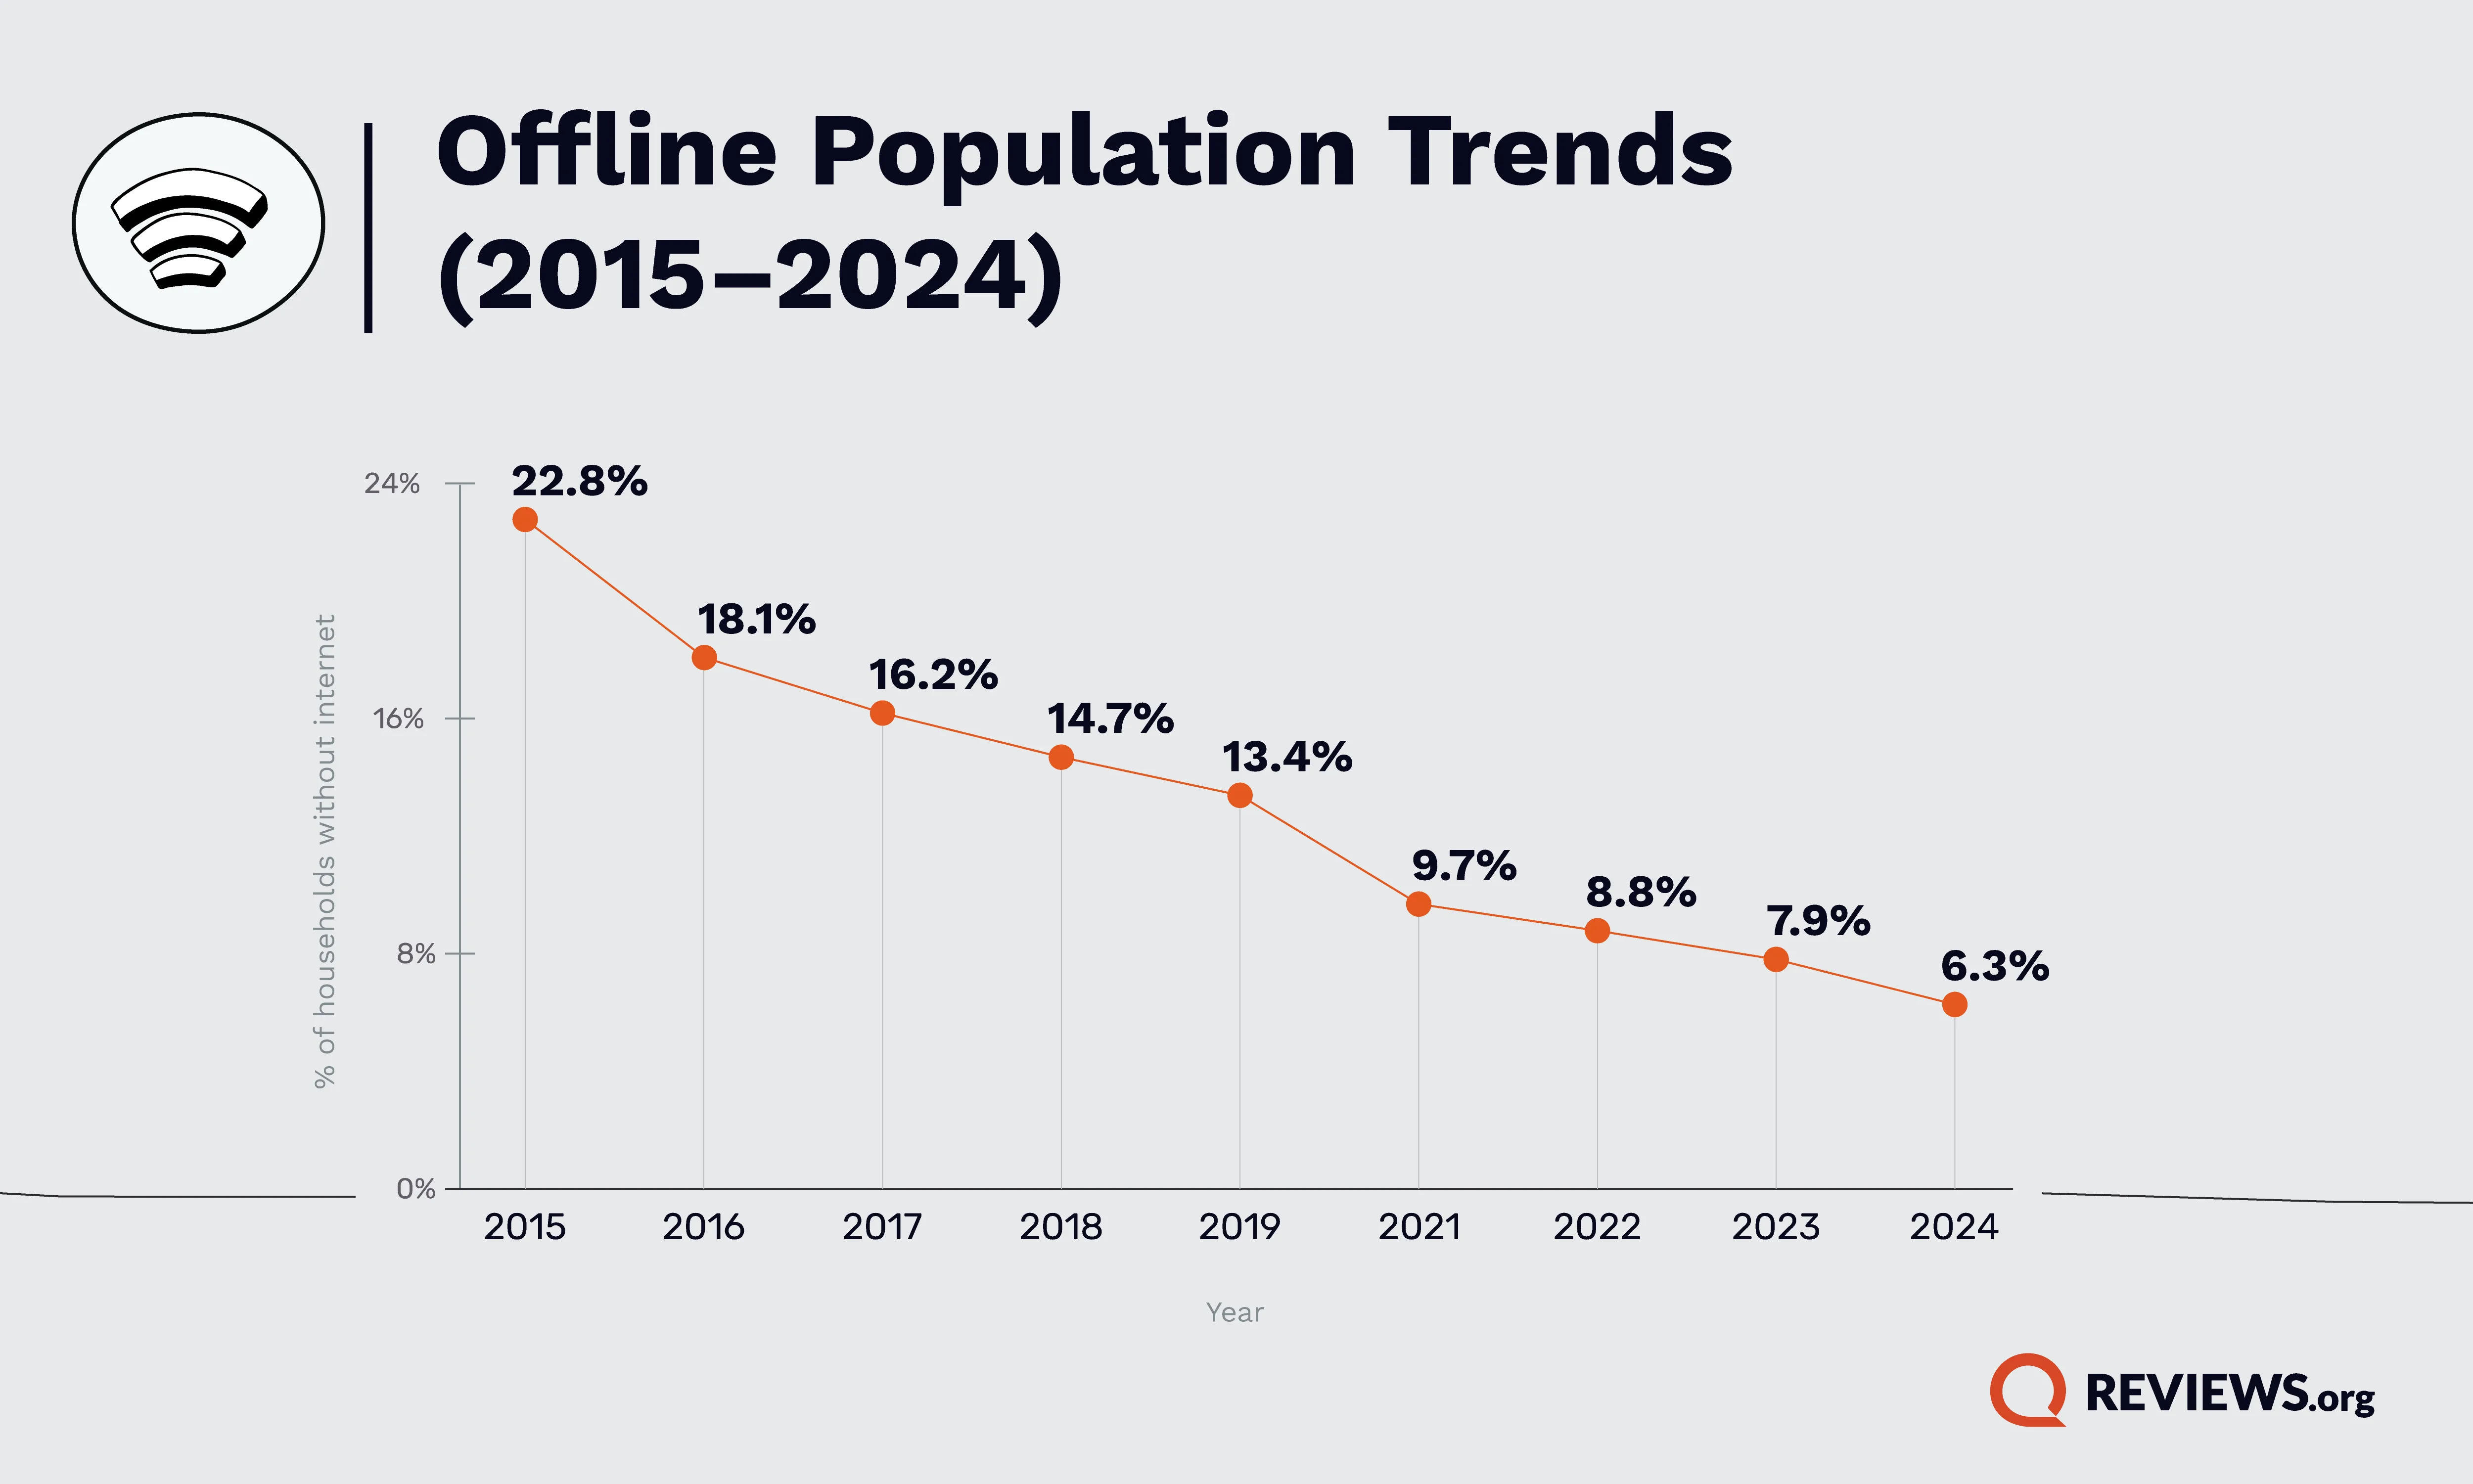
How the 'offline population' has declined since 2015
Since 2015, the U.S. "offline population" has shrunk dramatically, going from nearly 27 million down to 7.9 million in 2024, with the most dramatic shift coming between 2015 and 2016, when over 5 million more households came online, and then came another major decline throughout the pandemic years with a drop of 4 million households between 2019 and 2021.
Year (ACS 1-year estimates) | % with no internet | No. without internet |
| 2015 | 22.80% | 26,894,942 |
|---|
| 2016 | 18.10% | 21,552,653
|
|---|
| 2017 | 16.20% | 19,400,142
|
|---|
| 2018 | 14.70% | 17,821,382
|
|---|
| 2019 | 13.40% | "16,438,191"
|
|---|
| 2021 | 9.70% | 12,374,652
|
|---|
| 2022 | 8.80% | 11,493,275
|
|---|
| 2023 | 7.80% | 10,184,960
|
|---|
| 2024 | 6.29% | 7,908,541 |
|---|
More than 2 million Americans gained internet access between 2023 and 2024 alone. The offline population may fall below 5 million within the next couple of years if the trends hold, leading the internet to have nearly the same ubiquity of electricity or TV.
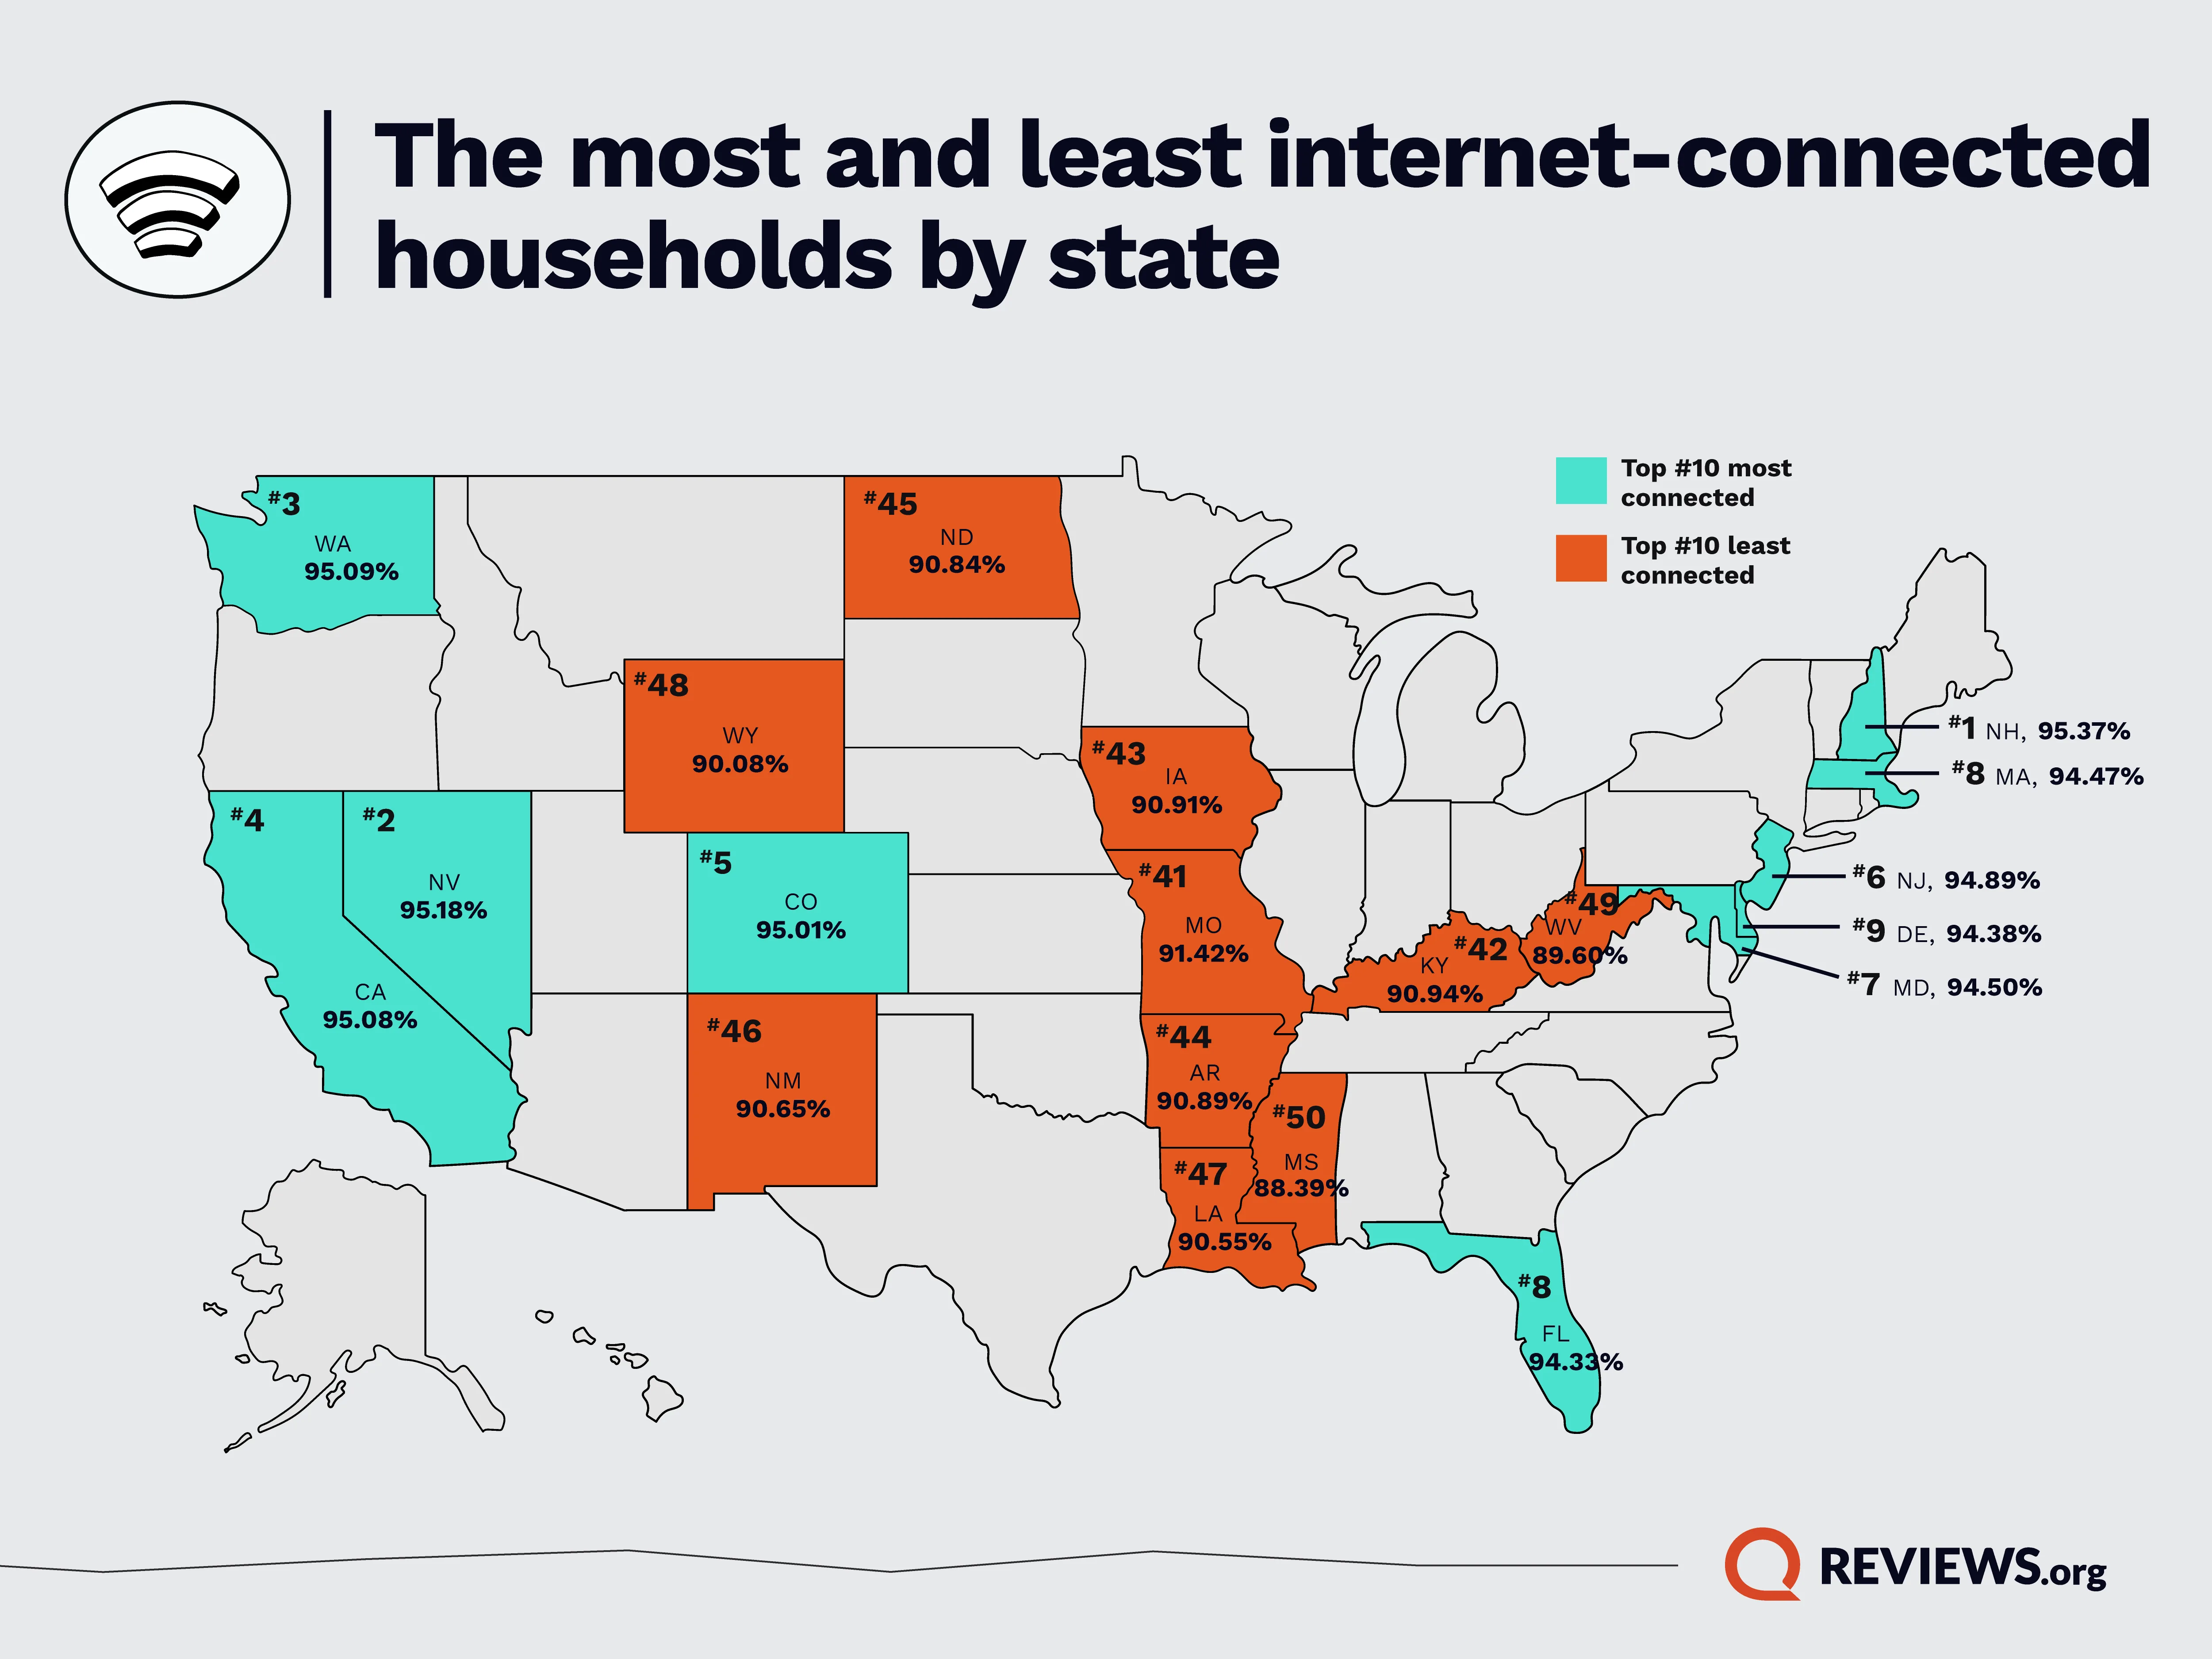
The 10 most and least internet-connected households by state
The 10 least connected states
Nationally, about 8 million, or 6%, of U.S. households lack broadband internet at home. The percentage of households without broadband internet in the United States varies significantly by state, with the states with the largest offline gaps tending to have higher-than-average poverty rates and sizable rural populations.
The least connected states cluster heavily in the South and Appalachia, with Mississippi topping the list at over 94,000 offline households; the Magnolia State has a high rural population (50.33%) and poverty rate (25.30%). Similarly, West Virginia, Arkansas, and Kentucky follow close behind with roughly 9% to 11% of households still unconnected.
State | % connected households | No. unconnected households | % rural population | Poverty rate |
| Mississippi | 88.39% | 94,402 | 50.33% | 25.30%
|
|---|
| West Virginia | 89.60% | 62,113 | 38.71% | 22.20%
|
|---|
| Wyoming | 90.08% | 17,709 | 69.02% | 13.30%
|
|---|
| Louisiana | 90.55% | 139,681 | 15.70% | 26.90%
|
|---|
| New Mexico | 90.65% | 57,343 | 32.64% | 23.90%
|
|---|
| North Dakota | 90.84% | 18,093 | 38.69% | 10.50%
|
|---|
| Arkansas | 90.89% | 90,298 | 38.62% | 21.80%
|
|---|
| Iowa | 90.91% | 76,765 | 38.02% | 14.30%
|
|---|
| Kentucky | 90.94% | 121,756 | 38.06% | 21.80%
|
|---|
| Missouri | 91.42% | 148,274 | 24.48% | 16.30% |
|---|
Sparsely populated states like Wyoming and North Dakota also demonstrate that high rural populations drag down overall connectivity rates despite a smaller number of offline homes.
Between infrastructure, affordability, and geography, the digital divide still affects millions of Americans, with certain areas of the United States without internet access facing particular challenges.
The 10 most connected states
In 2025, the most connected states are concentrated in the Northeast, West, and the fast-growing Sun Belt. New Hampshire tops the list with over 95% of online households, while Nevada, Washington, and California follow close behind.
State | % connected households | No. unconnected households | % rural population | Poverty rate |
| New Hampshire | 95.37% | 17,364 | 37.14% | 8.00%
|
|---|
| Nevada | 95.18% | 37,780 | 7.35% | 19.20%
|
|---|
| Washington | 95.09% | 94,380 | 10.26% | 13.40%
|
|---|
| California | 95.08% | 445,999 | 2.17% | 14.70%
|
|---|
| Colorado | 95.01% | 70,701 | 12.21% | 11.00%
|
|---|
| New Jersey | 94.89% | 133,116 | N/A | 12.60%
|
|---|
| Maryland | 94.50% | 87,183 | 4.42% | 12.90%
|
|---|
| Massachusetts | 94.47% | 110,476 | 1.52% | 12.70%
|
|---|
| Delaware | 94.38% | 16,673 | 25.54% | 16.50%
|
|---|
| Florida | 94.33% | 299,902 | 2.99% | 16.90% |
|---|
Places like California and Florida have high internet adoption rates, but they still have large offline populations. And though Nevada has a high poverty rate, the urbanization and infrastructure density lead to overall high adoption and a low population of offline residents.
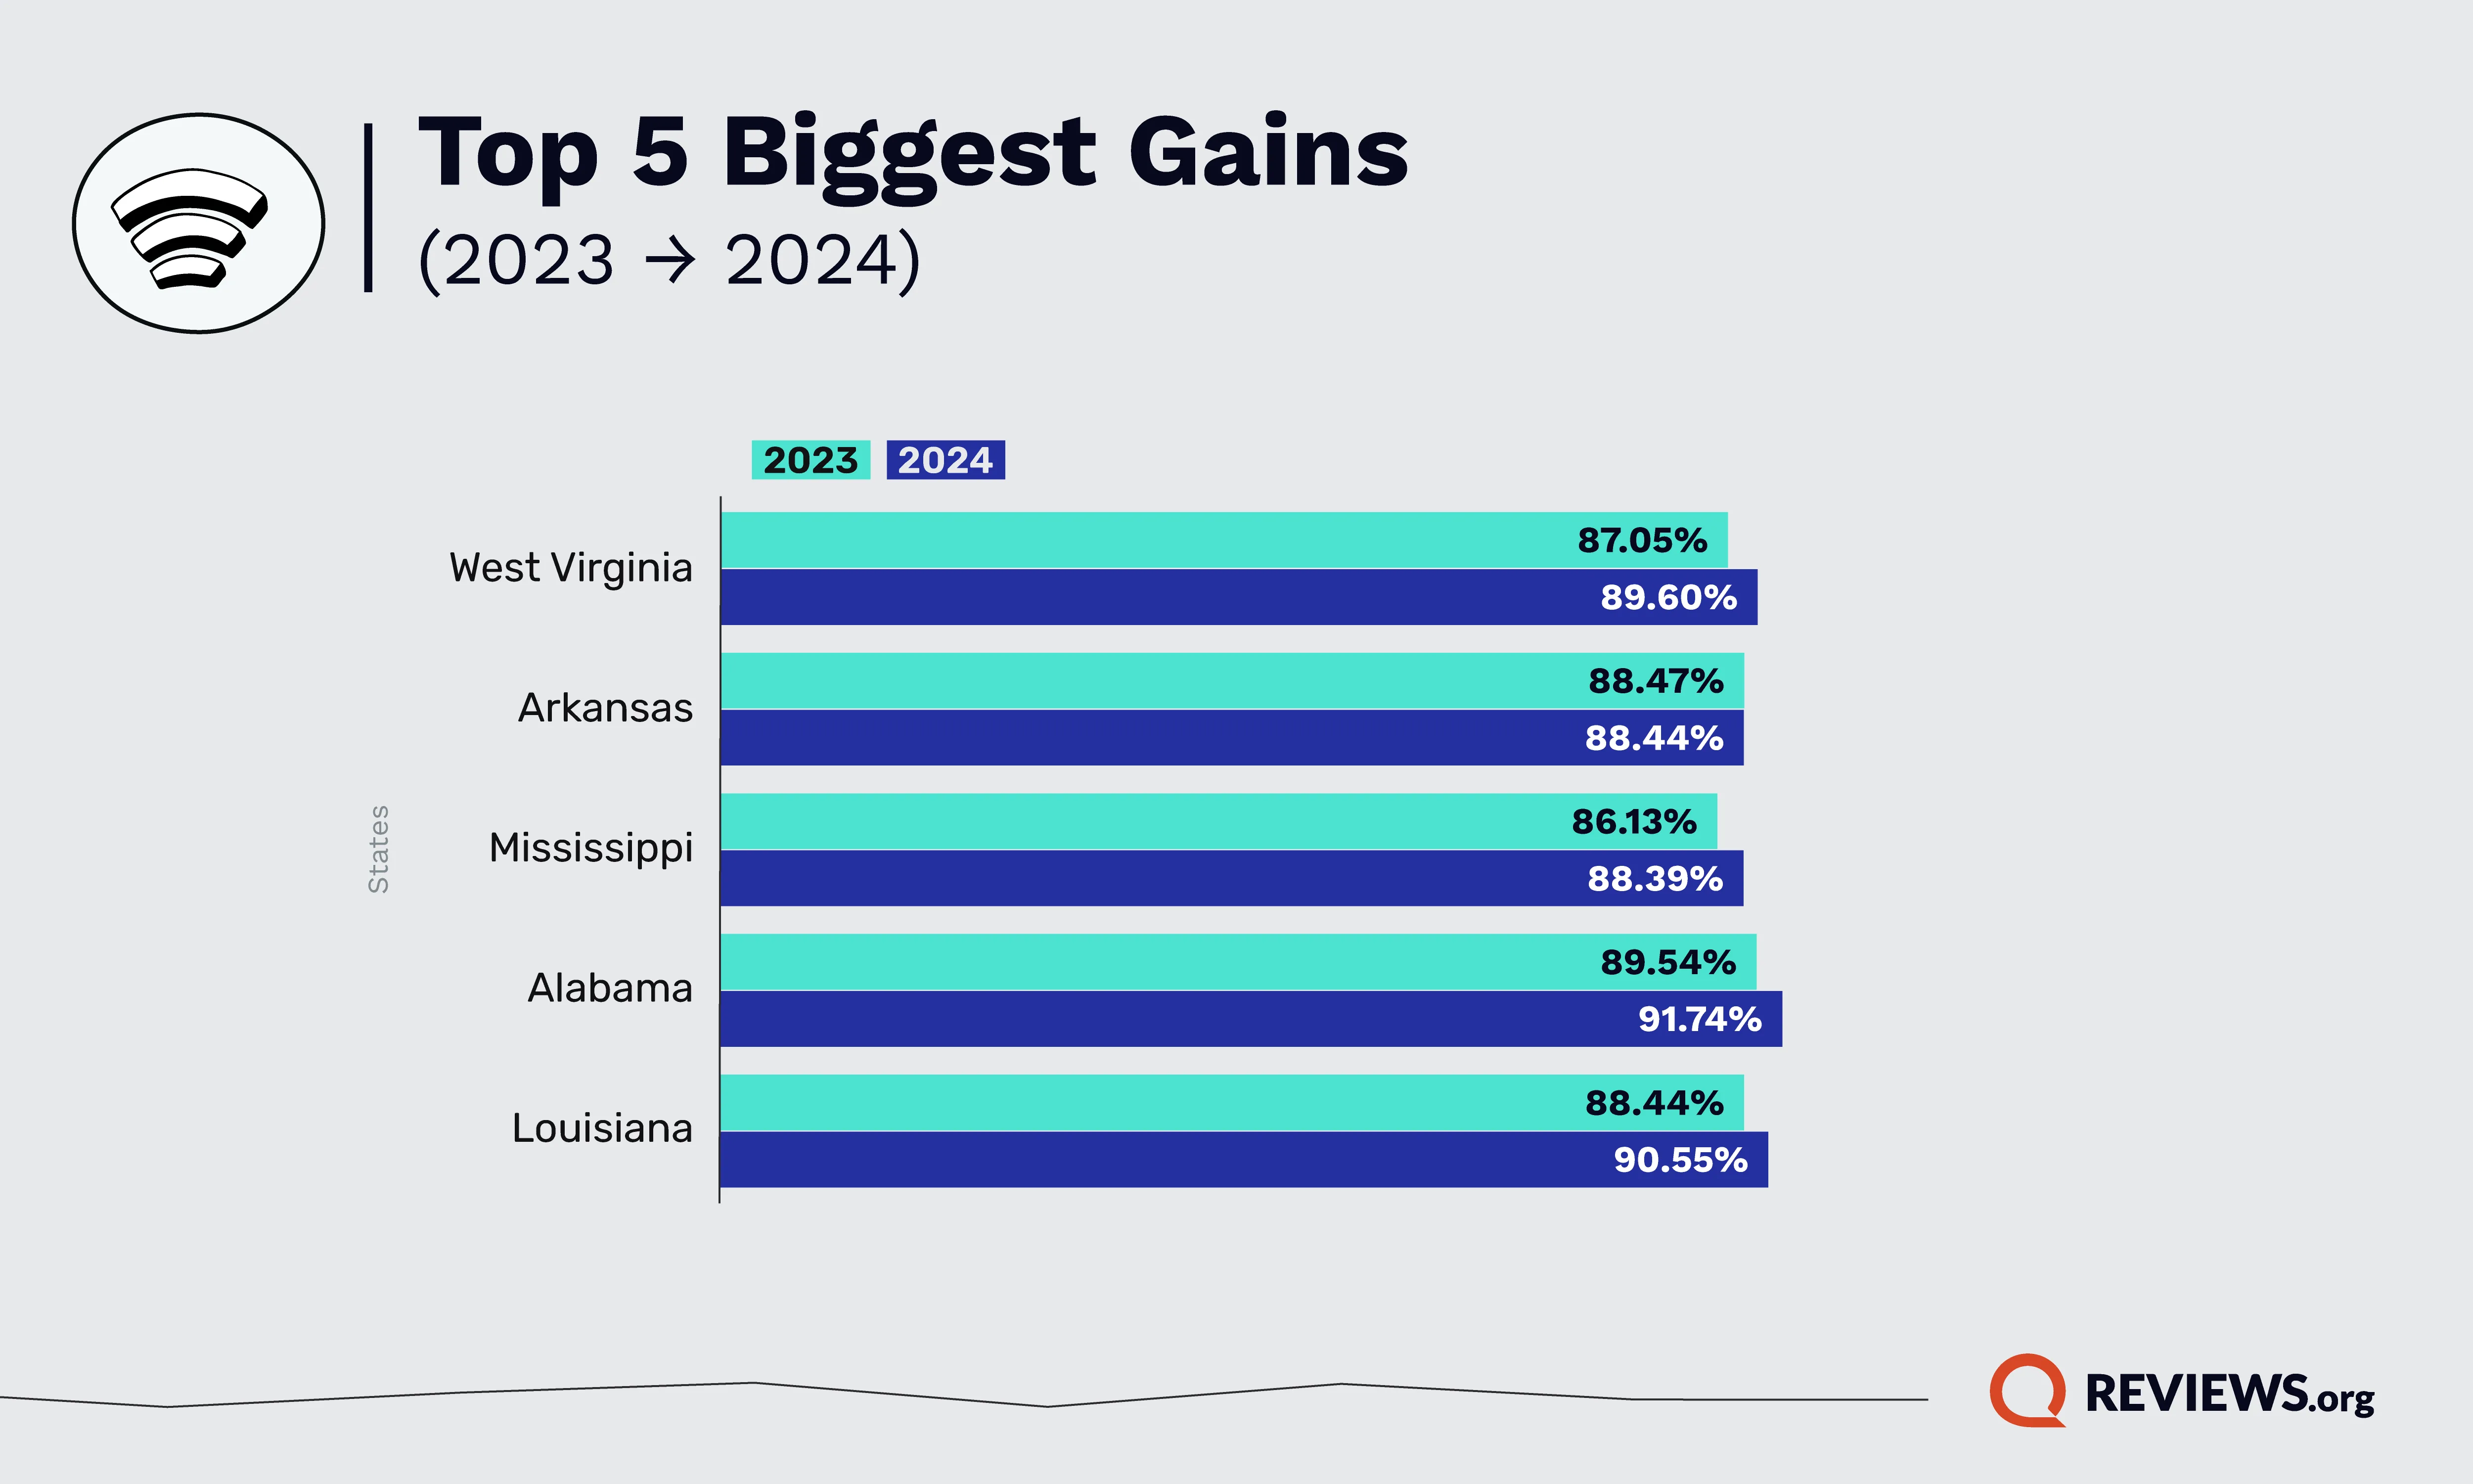
Household internet connection improvements by state
Looking at household internet connection improvements year over year by state (comparing 2023 to 2024 ACS 1-year estimate data), we can see that almost every state saw gains in household internet connectivity.
The Southern and Appalachian states have made the biggest improvements:
West Virginia leads the nation in improvement with a 2.55 percentage point increase, followed by Arkansas (up 2.42 percentage points) and Mississippi (up 2.26 percentage points). But it's not just the least-connected states making improvements. States like Delaware, Maine, and Vermont have also made gains (around 1 to 1.5 percentage points) to show the digital divide is closing even in well-connected regions.
The only state with a slight decline was Wyoming (down 0.74 percentage point), likely due to the challenges of building out rural infrastructure.
And in states where even slight increases are seen, it can mean the difference of tens of thousands of households coming online, such as in New Hampshire, California, and Washington.
States with the biggest increases in internet connectivity
State | % of connected households (2024) | % of connected households (2023) | Difference from 2023 to 2024
|
| West Virginia | 89.60% | 87.05% | 2.55%
|
|---|
| Arkansas | 90.89% | 88.47% | 2.42%
|
|---|
| Mississippi | 88.39% | 86.13% | 2.26%
|
|---|
| Alabama | 91.74% | 89.54% | 2.20%
|
|---|
| Louisiana | 90.55% | 88.44% | 2.11%
|
|---|
| New Mexico | 90.65% | 88.82% | 1.83%
|
|---|
| South Carolina | 92.95% | 91.32% | 1.63%
|
|---|
| Maine | 92.69% | 91.13% | 1.56%
|
|---|
| Delaware | 94.38% | 92.84% | 1.54%
|
|---|
| Vermont | 92.97% | 91.47% | 1.50%
|
|---|
| Kentucky | 90.94% | 89.49% | 1.45%
|
|---|
| Tennessee | 92.57% | 91.16% | 1.41%
|
|---|
| Oklahoma | 92.23% | 90.84% | 1.39%
|
|---|
| Connecticut | 94.15% | 92.76% | 1.39%
|
|---|
| South Dakota | 91.48% | 90.12% | 1.36%
|
|---|
| Florida | 94.33% | 93.00% | 1.33%
|
|---|
| Ohio | 92.33% | 91.02% | 1.31%
|
|---|
| New Hampshire | 95.37% | 94.11% | 1.26%
|
|---|
| North Dakota | 90.84% | 89.58% | 1.26%
|
|---|
| Pennsylvania | 92.28% | 91.02% | 1.26%
|
|---|
| Missouri | 91.42% | 90.16% | 1.26%
|
|---|
| Illinois | 93.02% | 91.77% | 1.25%
|
|---|
| New Jersey | 94.89% | 93.67% | 1.22%
|
|---|
| Arizona | 93.67% | 92.45% | 1.22%
|
|---|
| Michigan | 92.90% | 91.71% | 1.19%
|
|---|
| New York | 93.20% | 92.03% | 1.17%
|
|---|
| Rhode Island | 93.59% | 92.44% | 1.15%
|
|---|
| Indiana | 92.09% | 90.95% | 1.14%
|
|---|
| Massachusetts | 94.47% | 93.37% | 1.10%
|
|---|
| Kansas | 92.64% | 91.57% | 1.07%
|
|---|
| North Carolina | 93.25% | 92.18% | 1.07%
|
|---|
| Maryland | 94.50% | 93.44% | 1.06%
|
|---|
| Oregon | 93.80% | 92.77% | 1.03%
|
|---|
| Georgia | 93.51% | 92.49% | 1.02%
|
|---|
| Virginia | 92.91% | 91.90% | 1.01%
|
|---|
| Montana | 91.70% | 90.69% | 1.01%
|
|---|
| Texas | 93.76% | 92.77% | 0.99%
|
|---|
| Nebraska | 92.05% | 91.16% | 0.89%
|
|---|
| Washington | 95.09% | 94.27% | 0.82%
|
|---|
| Utah | 94.09% | 93.30% | 0.79%
|
|---|
| Minnesota | 93.01% | 92.23% | 0.78%
|
|---|
| California | 95.08% | 94.31% | 0.77%
|
|---|
| Iowa | 90.91% | 90.16% | 0.75%
|
|---|
| Nevada | 95.18% | 94.51% | 0.67%
|
|---|
| Wisconsin | 92.49% | 91.83% | 0.66%
|
|---|
| Colorado | 95.01% | 94.60% | 0.41%
|
|---|
| Alaska | 93.62% | 93.21% | 0.41%
|
|---|
| District of Columbia | 92.53% | 92.13% | 0.40%
|
|---|
| Hawaii | 93.11% | 92.73% | 0.38%
|
|---|
| Idaho | 92.94% | 92.93% | 0.01%
|
|---|
| Wyoming | 90.08% | 90.82% | -0.74% |
|---|
Overall, the U.S. is making meaningful strides toward widespread broadband access in the United States: The offline population has severely fallen over the past decade, rural and high-poverty areas are seeing the fastest gains, and the digital divide is shrinking. Though challenges remain, especially in lower-income and sparsely populated areas, America's digital divide is closing steadily.
To get our ranking of the states with the most and least connected households, we sourced the latest 2024 American Community Survey published on Sept. 11, 2025. ACS 1-year estimates were used to get the most up-to-date information on a state level.
Want to see how all 50 states compare?
Here’s a full view of US home internet connectivity at a state-by-state level. We ranked each state by the total percent of households that have either a broadband (cable, DSL, or fiber), dial-up, or satellite internet connection at home.
State | % connected households (ACS 2024) | No. unconnected households (ACS 2024) | % Rural Population | Poverty Rate |
| New Hampshire | 95.37% | 17,364 | 37.14% | 8.00%
|
|---|
| Nevada | 95.18% | 37,780 | 7.35% | 19.20%
|
|---|
| Washington | 95.09% | 94,380 | 10.26% | 13.40%
|
|---|
| California | 95.08% | 445,999 | 2.17% | 14.70%
|
|---|
| Colorado | 95.01% | 70,701 | 12.21% | 11.00%
|
|---|
| New Jersey | 94.89% | 133,116 | N/A | 12.60%
|
|---|
| Maryland | 94.50% | 87,183 | 4.42% | 12.90%
|
|---|
| Massachusetts | 94.47% | 110,476 | 1.52% | 12.70%
|
|---|
| Delaware | 94.38% | 16,673 | 25.54% | 16.50%
|
|---|
| Florida | 94.33% | 299,902 | 2.99% | 16.90%
|
|---|
| Connecticut | 94.15% | 60,093 | 5.81% | 13.20%
|
|---|
| Utah | 94.09% | 32,447 | 12.13% | 9.60%
|
|---|
| Oregon | 93.80% | 64,712 | 15.18% | 15.00%
|
|---|
| Texas | 93.76% | 482,150 | 9.68% | 19.60%
|
|---|
| Arizona | 93.67% | 125,634 | 4.62% | 17.10%
|
|---|
| Alaska | 93.62% | 12,196 | 32.35% | 14.50%
|
|---|
| Rhode Island | 93.59% | 20,636 | N/A | 16.60%
|
|---|
| Georgia | 93.51% | 184,110 | 16.59% | 19.90%
|
|---|
| North Carolina | 93.25% | 205,784 | 20.55% | 18.40%
|
|---|
| New York | 93.20% | 374,499 | 7.00% | 19.10%
|
|---|
| Hawaii | 93.11% | 20,719 | 19.61% | 11.40%
|
|---|
| Illinois | 93.02% | 239,112 | 12.76% | 15.00%
|
|---|
| Minnesota | 93.01% | 102,159 | 16.64% | 10.30%
|
|---|
| Vermont | 92.97% | 12,770 | 64.79% | 10.70%
|
|---|
| South Carolina | 92.95% | 107,825 | 13.58% | 19.50%
|
|---|
| Idaho | 92.94% | 28,908 | 26.33% | 13.20%
|
|---|
| Virginia | 92.91% | 172,371 | 12.28% | 12.70%
|
|---|
| Michigan | 92.90% | 207,588 | 16.64% | 18.00%
|
|---|
| Maine | 92.69% | 33,287 | 40.15% | 12.80%
|
|---|
| Kansas | 92.64% | 62,224 | 29.22% | 14.50%
|
|---|
| Tennessee | 92.57% | 161,064 | 21.21% | 19.20%
|
|---|
| Wisconsin | 92.49% | 127,322 | 25.49% | 13.50%
|
|---|
| Ohio | 92.33% | 264,433 | 18.00% | 18.60%
|
|---|
| Pennsylvania | 92.28% | 303,410 | 13.54% | 16.80%
|
|---|
| Oklahoma | 92.23% | 88,805 | 32.11% | 22.80%
|
|---|
| Indiana | 92.09% | 156,495 | 21.71% | 16.60%
|
|---|
| Nebraska | 92.05% | 44,228 | 34.11% | 11.80%
|
|---|
| Alabama | 91.74% | 126,602 | 21.94% | 23.20%
|
|---|
| Montana | 91.70% | 26,959 | 44.76% | 14.00%
|
|---|
| South Dakota | 91.48% | 22,454 | 49.08% | 14.40%
|
|---|
| Missouri | 91.42% | 148,274 | 24.48% | 16.30%
|
|---|
| Kentucky | 90.94% | 121,756 | 38.06% | 21.80%
|
|---|
| Iowa | 90.91% | 76,765 | 38.02% | 14.30%
|
|---|
| Arkansas | 90.89% | 90,298 | 38.62% | 21.80%
|
|---|
| North Dakota | 90.84% | 18,093 | 38.69% | 10.50%
|
|---|
| New Mexico | 90.65% | 57,343 | 32.64% | 23.90%
|
|---|
| Louisiana | 90.55% | 139,681 | 15.70% | 26.90%
|
|---|
| Wyoming | 90.08% | 17,709 | 69.02% | 13.30%
|
|---|
| West Virginia | 89.60% | 62,113 | 38.71% | 22.20%
|
|---|
| Mississippi | 88.39% | 94,402 | 50.33% | 25.30% |
|---|